Dax (Germany) index Elliott Wave technical analysis [Video]
![Dax (Germany) index Elliott Wave technical analysis [Video]](https://editorial.fxstreet.com/images/Markets/Equities/Industries/HealthCare/surgery-masks_XtraLarge.jpg)
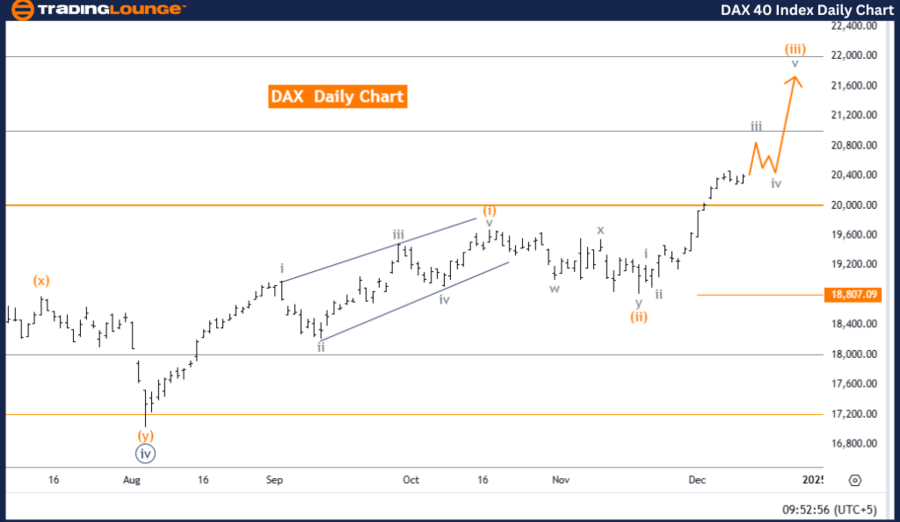
DAX (Germany) Elliott Wave Analysis - Trading Lounge Day Chart
DAX (Germany) Elliott Wave technical analysis
-
Function: Bullish Trend.
-
Mode: Impulsive.
-
Structure: Gray Wave 3.
-
Position: Orange Wave 3.
-
Direction next lower degrees: Gray Wave 4.
Details:
The analysis indicates that gray wave 2 is likely completed, with gray wave 3 now in progress.
Wave Cancel Invalidation Level: 18,807.92
Analysis overview:
The DAX Germany daily chart demonstrates a bullish trend analyzed through the Elliott Wave framework. The wave mode is categorized as impulsive, highlighting the ongoing development of gray wave 3 within the larger market structure. This phase represents the continuation of upward momentum, a key characteristic of impulsive waves in Elliott Wave theory.
Current wave context:
-
Gray wave 2 is considered complete, with the market advancing into gray wave 3.
-
Within this phase, orange wave 3 is actively contributing to the broader progression of gray wave 3, which typically shows strong price movement indicative of significant trend advancement.
Invalidation level:
-
The current wave count becomes invalid if the price breaches 18,807.92, requiring a reassessment of the Elliott Wave structure and the market's overall trend direction.
Implications of gray wave three:
This stage in the Elliott Wave sequence is pivotal, as gray wave 3 often represents one of the most dynamic and extended segments within the impulsive phase. The strong upward trajectory of this wave underscores a robust market sentiment driving the bullish trend.
Trading insights:
-
Traders can monitor key levels and price action within gray wave 3 to align their strategies with the anticipated continuation of the upward trend.
-
Recognizing wave dynamics during this impulsive phase provides opportunities to adjust trading decisions effectively, optimizing for the expected market progression.
-
The completion of this impulsive wave could signal further trading opportunities as the market transitions into subsequent wave formations.
By leveraging the insights from this analysis, participants can navigate the ongoing bullish trend with a better understanding of wave dynamics and potential market movements.
DAX (Germany) Elliott Wave technical analysis
-
Function: Bullish Trend.
-
Mode: Impulsive.
-
Structure: Orange Wave 3.
-
Position: Navy Blue Wave 5.
-
Direction next lower degrees: Orange Wave 4.
Details:
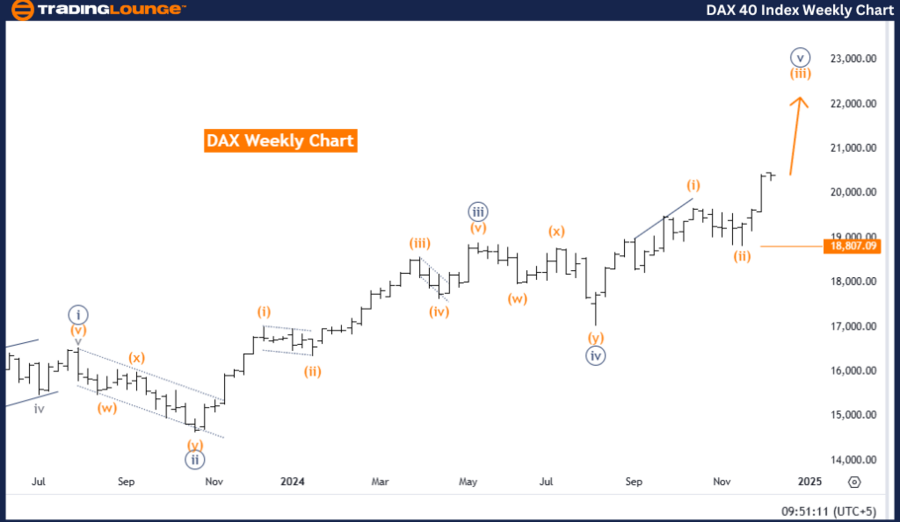
The analysis suggests orange wave 2 is likely completed, with orange wave 3 now in progress.
Wave Cancel Invalidation Level: 18,807.92
Analysis overview:
The DAX Germany weekly chart reflects a bullish trend analyzed through the Elliott Wave framework. The wave mode is impulsive, signifying strong upward momentum as the market progresses within orange wave 3. This phase highlights a continuation of the prevailing trend, indicating further upward price movement is likely.
Current wave context:
-
Orange wave 2 is considered complete, and the market has entered orange wave 3, a phase known for strength and acceleration.
-
Within this impulsive structure, navy blue wave 5 represents the current position, marking the culmination of earlier sub-waves and the extension of the broader bullish trend.
Invalidation level:
-
If the price falls below 18,807.92, the current wave count becomes invalid, necessitating a reassessment of the market structure and overall trend direction.
Characteristics of orange wave three:
Orange wave 3 is typically regarded as the most powerful and extended phase within an impulsive wave cycle. Its progression emphasizes the market's dynamic bullish sentiment, further reinforced by the ongoing navy blue wave 5.
Trading insights:
-
Traders and analysts should closely monitor key levels and wave developments during this phase to optimize trading strategies.
-
The unfolding of orange wave 3 provides an opportunity to align with the ongoing upward momentum, preparing for a potential transition into orange wave 4.
-
Understanding wave dynamics at this stage can help navigate the trend effectively and capitalize on potential market movements.
By leveraging this Elliott Wave analysis, market participants can position themselves strategically to take advantage of the continuing bullish trend as orange wave 3 drives the market higher.
Technical analyst: Malik Awais.
DAX (Germany) Elliott Wave technical analysis [Video]
Author

Peter Mathers
TradingLounge
Peter Mathers started actively trading in 1982. He began his career at Hoei and Shoin, a Japanese futures trading company.


