DAX (Germany) Elliott Wave technical analysis [Video]
![DAX (Germany) Elliott Wave technical analysis [Video]](https://editorial.fxsstatic.com/images/i/Germany_XtraLarge.png)
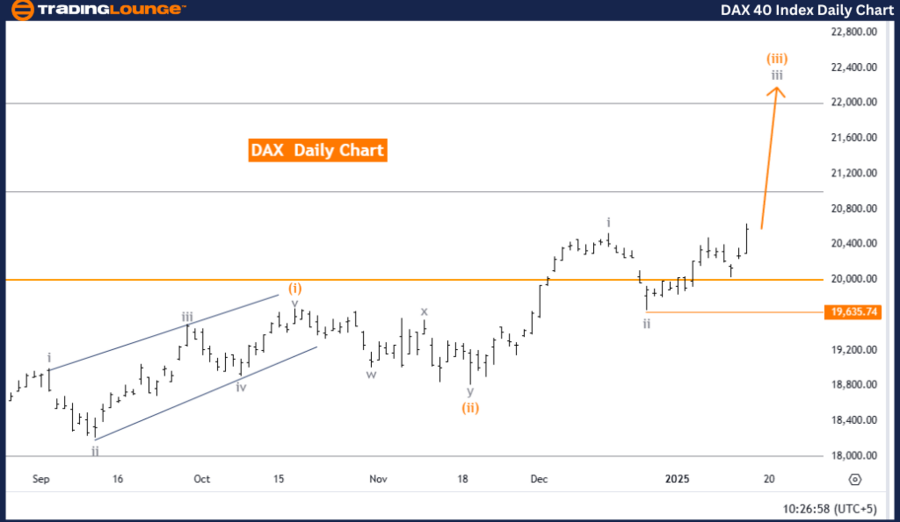
DAX (Germany) Elliott Wave Analysis Trading Lounge Day Chart.
DAX (Germany) Elliott Wave technical analysis
Technical analysis overview
-
Function: Bullish Trend.
-
Mode: Impulsive.
-
Structure: Gray Wave 3.
-
Position: Orange Wave 3.
-
Direction next lower degrees: Gray Wave 4.
-
Details: Gray wave 2 appears completed; gray wave 3 is currently active.
-
Wave cancel invalidation level: 19,635.74.
The DAX (Germany) is currently exhibiting a strong bullish trend, as indicated by the Elliott Wave Analysis on the daily chart. The market is advancing within an impulsive wave structure, specifically gray wave 3, which signals a robust upward momentum aligned with the overall positive trend.
The completion of gray wave 2 has paved the way for the current progression within gray wave 3. This phase highlights the continuation of bullish momentum, with orange wave 3 playing a significant role in the ongoing impulsive sequence. The market’s position in orange wave 3 represents an acceleration phase within gray wave 3, reinforcing the upward trajectory.
An important invalidation level is identified at 19,635.74. A drop below this threshold would negate the current wave structure and necessitate a reassessment of the market’s wave configuration. This level serves as a crucial benchmark for ensuring the validity of the ongoing bullish wave.
Summary
-
The DAX (Germany) is firmly in a bullish phase, with gray wave 3 actively unfolding after the completion of gray wave 2.
-
The current position within orange wave 3 emphasizes the strength of the impulsive movement, supporting the upward trend.
-
The invalidation level at 19,635.74 serves as a key point for verifying the wave structure's accuracy.
-
Attention remains on the progression of gray wave 3, with a focus on maintaining levels above the invalidation threshold to confirm the bullish trend.
DAX (Germany) Elliott Wave technical analysis
Technical Analysis Overview
-
Function: Bullish Trend.
-
Mode: Impulsive.
-
Structure: Orange Wave 3.
-
Position: Navy Blue Wave 5.
-
Direction next lower degrees: Orange Wave 4.
-
Details: Orange wave 2 appears completed; orange wave 3 is actively unfolding.
-
Wave cancel invalidation level: 18,764.15.
The DAX (Germany) weekly chart illustrates a sustained bullish trend, as revealed by the Elliott Wave Analysis. The market is progressing through an impulsive wave structure, specifically orange wave 3, which signals the continuation of the broader upward momentum, in line with the overall bullish outlook.
The completion of orange wave 2 has established the groundwork for the ongoing progression within orange wave 3. The market's current position in navy blue wave 5 highlights the continued development of the impulsive sequence and reinforces the prevailing positive trend. This phase of orange wave 3 reflects a robust and accelerating segment of the upward trajectory, underscoring the strength of the bullish movement.
An important invalidation level has been identified at 18,764.15. A decline below this threshold would invalidate the current wave structure and necessitate a reassessment of the market's wave pattern. This level acts as a critical benchmark for verifying the validity of the ongoing bullish wave progression.
Summary
-
The DAX (Germany) weekly chart continues to reflect a strong bullish trend, with orange wave 3 actively unfolding after the completion of orange wave 2.
-
The market's position in navy blue wave 5 emphasizes the upward momentum within the impulsive structure.
-
The invalidation level at 18,764.15 is a key point for confirming the accuracy of the current wave analysis.
-
Focus remains on the progression of orange wave 3, with close attention on maintaining levels above the invalidation threshold to sustain the bullish outlook.

DAX (Germany) Elliott Wave technical analysis [Video]
Author

Peter Mathers
TradingLounge
Peter Mathers started actively trading in 1982. He began his career at Hoei and Shoin, a Japanese futures trading company.


