DAX (Germany) Elliott Wave technical analysis [Video]
![DAX (Germany) Elliott Wave technical analysis [Video]](https://editorial.fxstreet.com/images/Markets/Equities/DAX/dax-macro-concept-57844002_XtraLarge.jpg)
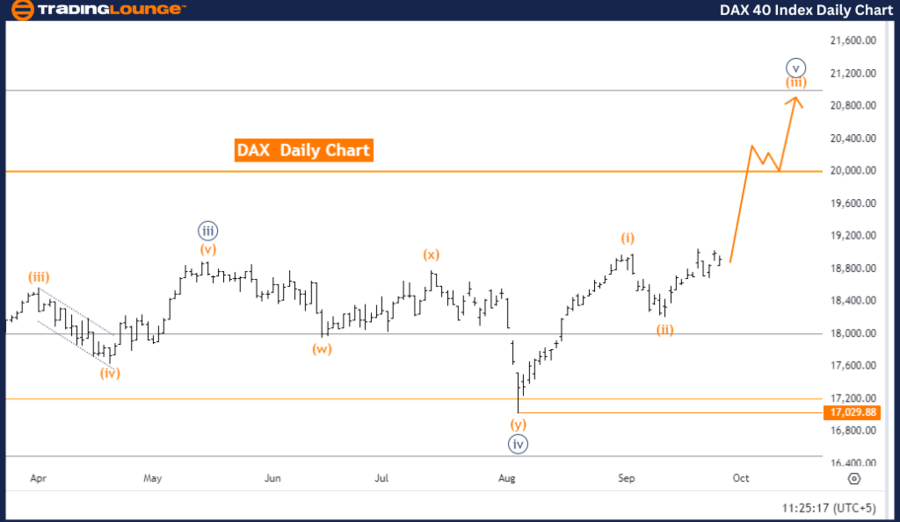
DAX (Germany) Elliott Wave analysis - Day chart
Function: Bullish Trend.
Mode: Impulsive.
Structure: Orange Wave 3.
Position: Navy Blue Wave 5.
Next lower degree direction: Orange Wave 4.
The DAX Day Chart for Germany, based on Elliott Wave analysis, indicates a bullish trend. The market is currently in an impulsive mode, which suggests a strong upward movement. The chart structure is highlighting orange wave 3, part of a larger wave cycle.
The market is positioned in navy blue wave 5, representing an advanced phase of this bullish cycle. Orange wave 2 has completed its corrective phase, and orange wave 3 of 5 is currently in progress, further driving the market upwards.
The next anticipated movement in the cycle is orange wave 4, expected to introduce a temporary corrective phase following the completion of orange wave 3. For now, however, orange wave 3 continues its impulsive push, indicating further upward momentum.
The wave invalidation level for this structure is set at 17029.88. If the price drops below this threshold, the current wave count would be invalidated, necessitating a reassessment of the wave structure. As long as the price remains above 17029.88, the bullish trend and wave formation are expected to continue.
Summary
-
The DAX Day Chart shows a bullish trend in an impulsive mode.
-
Orange wave 2 has completed, and orange wave 3 of 5 is unfolding.
-
The market is positioned in navy blue wave 5.
-
The next lower degree wave is orange wave 4.
-
The invalidation level is 17029.88. As long as the price stays above this, the bullish momentum is expected to continue.
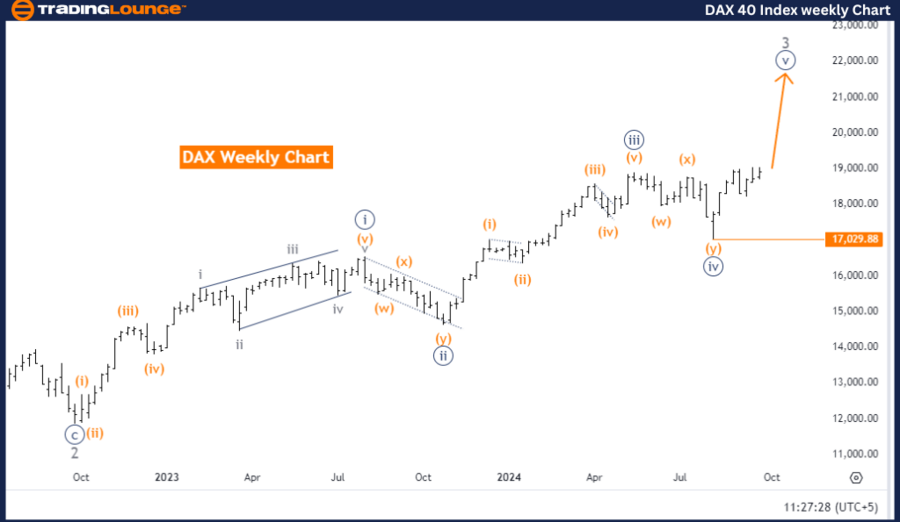
DAX (Germany) Elliott Wave analysis - Weekly chart
Function: Bullish Trend.
Mode: Impulsive.
Structure: Navy Blue Wave 5.
Position: Gray Wave 3.
Next lower degree direction: Gray Wave 4.
The DAX Weekly Chart for Germany, analyzed using the Elliott Wave method, shows a bullish trend. The market is currently in an impulsive mode, indicating strong upward price action. The key structure is navy blue wave 5, which signifies the final stage of this wave cycle.
At present, the market is positioned in gray wave 3, which is propelling the ongoing upward trend. The next expected movement is gray wave 4, likely to introduce a corrective phase once gray wave 3 completes. However, for the moment, the chart reflects the continuation of the impulsive rise in navy blue wave 5.
Navy blue wave 4 is considered complete, and the market has moved into navy blue wave 5, indicating further advancement in this wave structure and the maintenance of the bullish trend.
The wave invalidation level for this structure is set at 17029.88. If the price drops below this point, the current wave structure would be invalidated, requiring a reanalysis. However, as long as the price remains above 17029.88, the bullish outlook for the market stays intact.
Summary
-
The DAX Weekly Chart indicates a bullish trend in an impulsive mode.
-
Navy blue wave 4 has been completed, and navy blue wave 5 is now progressing.
-
The market is positioned in gray wave 3, with gray wave 4 expected next.
-
The wave invalidation level is set at 17029.88. As long as the price stays above this, the bullish trend is expected to continue.
DAX (Germany) Elliott Wave technical analysis [Video]
Author

Peter Mathers
TradingLounge
Peter Mathers started actively trading in 1982. He began his career at Hoei and Shoin, a Japanese futures trading company.


