DAX (Germany) Elliott Wave technical analysis [Video]
![DAX (Germany) Elliott Wave technical analysis [Video]](https://editorial.fxstreet.com/images/Markets/Equities/DAX/dax-euro-concept-47253534_XtraLarge.jpg)
DAX (Germany) Elliott Wave technical analysis
Function: Counter Trend.
Mode: Corrective.
Structure: Orange wave 2.
Position: Navy blue wave 5.
Direction next higher degrees: Orange wave 3.
Details: Orange wave 1 has been completed. Now, orange wave 2 of 5 is in play.
Wave Cancel Invalid Level: 17029.88
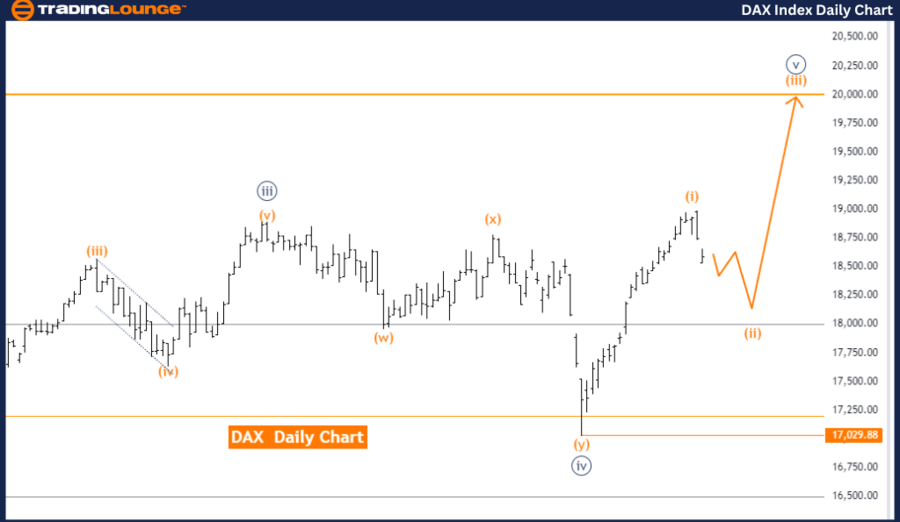
The DAX (Germany) daily chart is currently in a counter-trend mode, indicating that the market is in a corrective phase. The Elliott Wave structure under examination focuses on orange wave 2, which is part of a broader wave sequence.
Currently, the market is positioned within navy blue wave 5, suggesting that the market is nearing the end of this wave cycle. The next expected movement points toward orange wave 3 in the higher degree, signaling the potential for a significant move once the corrective phase concludes.
Additionally, orange wave 1 has been completed, marking the end of the initial impulsive wave and the beginning of the ongoing corrective wave. Orange wave 2 of navy blue wave 5 is now unfolding, indicating a period of consolidation or pullback before the next major movement occurs.
The invalidation level for this wave count is set at 17029.88. This level serves as a critical marker; if the market breaches this point, it would invalidate the current wave structure and necessitate a reassessment of the Elliott Wave count.
In conclusion, the DAX is presently in a corrective phase, with orange wave 2 of navy blue wave 5 in progress. Orange wave 1 has been completed, and following the correction, the market is expected to move into orange wave 3. The invalidation level remains at 17029.88, which is a key reference for this analysis. Traders should closely monitor this level to determine if the corrective phase holds or if a new wave structure develops.
DAX (Germany) daily chart
DAX (Germany) Elliott Wave technical analysis
Function: Trend.
Mode: Impulsive.
Structure: Navy blue wave 5.
Position: Gray wave 3
Direction next lower degrees: Gray wave 4.
Details: Navy blue wave 4 has been completed. Now, navy blue wave 5 is in play.
Wave cancel invalid level: 17029.88.
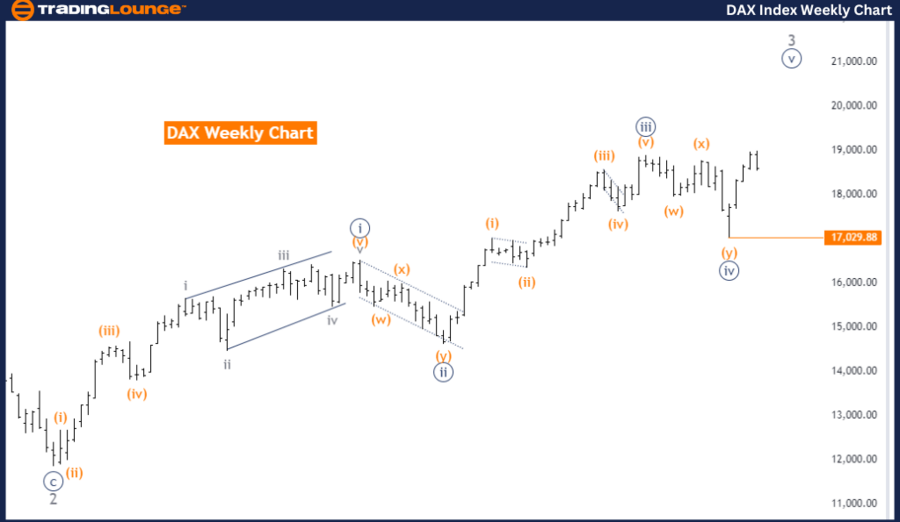
The DAX (Germany) weekly chart is currently in a trend mode, indicating that the market is experiencing an impulsive movement. The Elliott Wave structure being analyzed focuses on navy blue wave 5, which is part of a broader wave sequence.
The current market position is in gray wave 3, signaling the continuation of the impulsive cycle, with navy blue wave 5 now in play. This wave represents the final push in the sequence before the market enters a corrective phase. The direction for the next lower degrees points to gray wave 4, which indicates the upcoming phase once the current impulsive wave concludes.
The analysis shows that navy blue wave 4 has been completed, marking the end of the corrective wave and the beginning of navy blue wave 5. This suggests that the market is now in an advancing phase, with further upward movement likely as the impulsive wave develops.
The wave cancel invalidation level is set at 17029.88, which serves as a key reference point for the current wave structure. If the market falls below this level, the existing Elliott Wave count would be invalidated, necessitating a reassessment of the trend and wave pattern.
In conclusion, the DAX is currently following an impulsive trend, with navy blue wave 5 in progress after the completion of navy blue wave 4. The next expected phase is gray wave 4, following the completion of gray wave 3. Traders should keep an eye on the invalidation level at 17029.88 to assess whether the current wave structure holds or needs reconsideration due to market changes.
DAX (Germany) weekly chart
DAX (Germany) Elliott Wave technical analysis [Video]
Author

Peter Mathers
TradingLounge
Peter Mathers started actively trading in 1982. He began his career at Hoei and Shoin, a Japanese futures trading company.


