DAX 40: Keeps the price close to the resistance level at 14,550

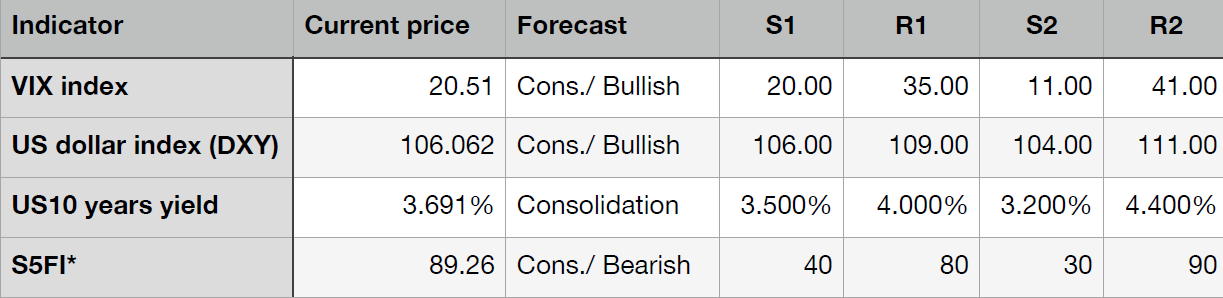
Price in local currency
S&P 500 stocks above 50MA
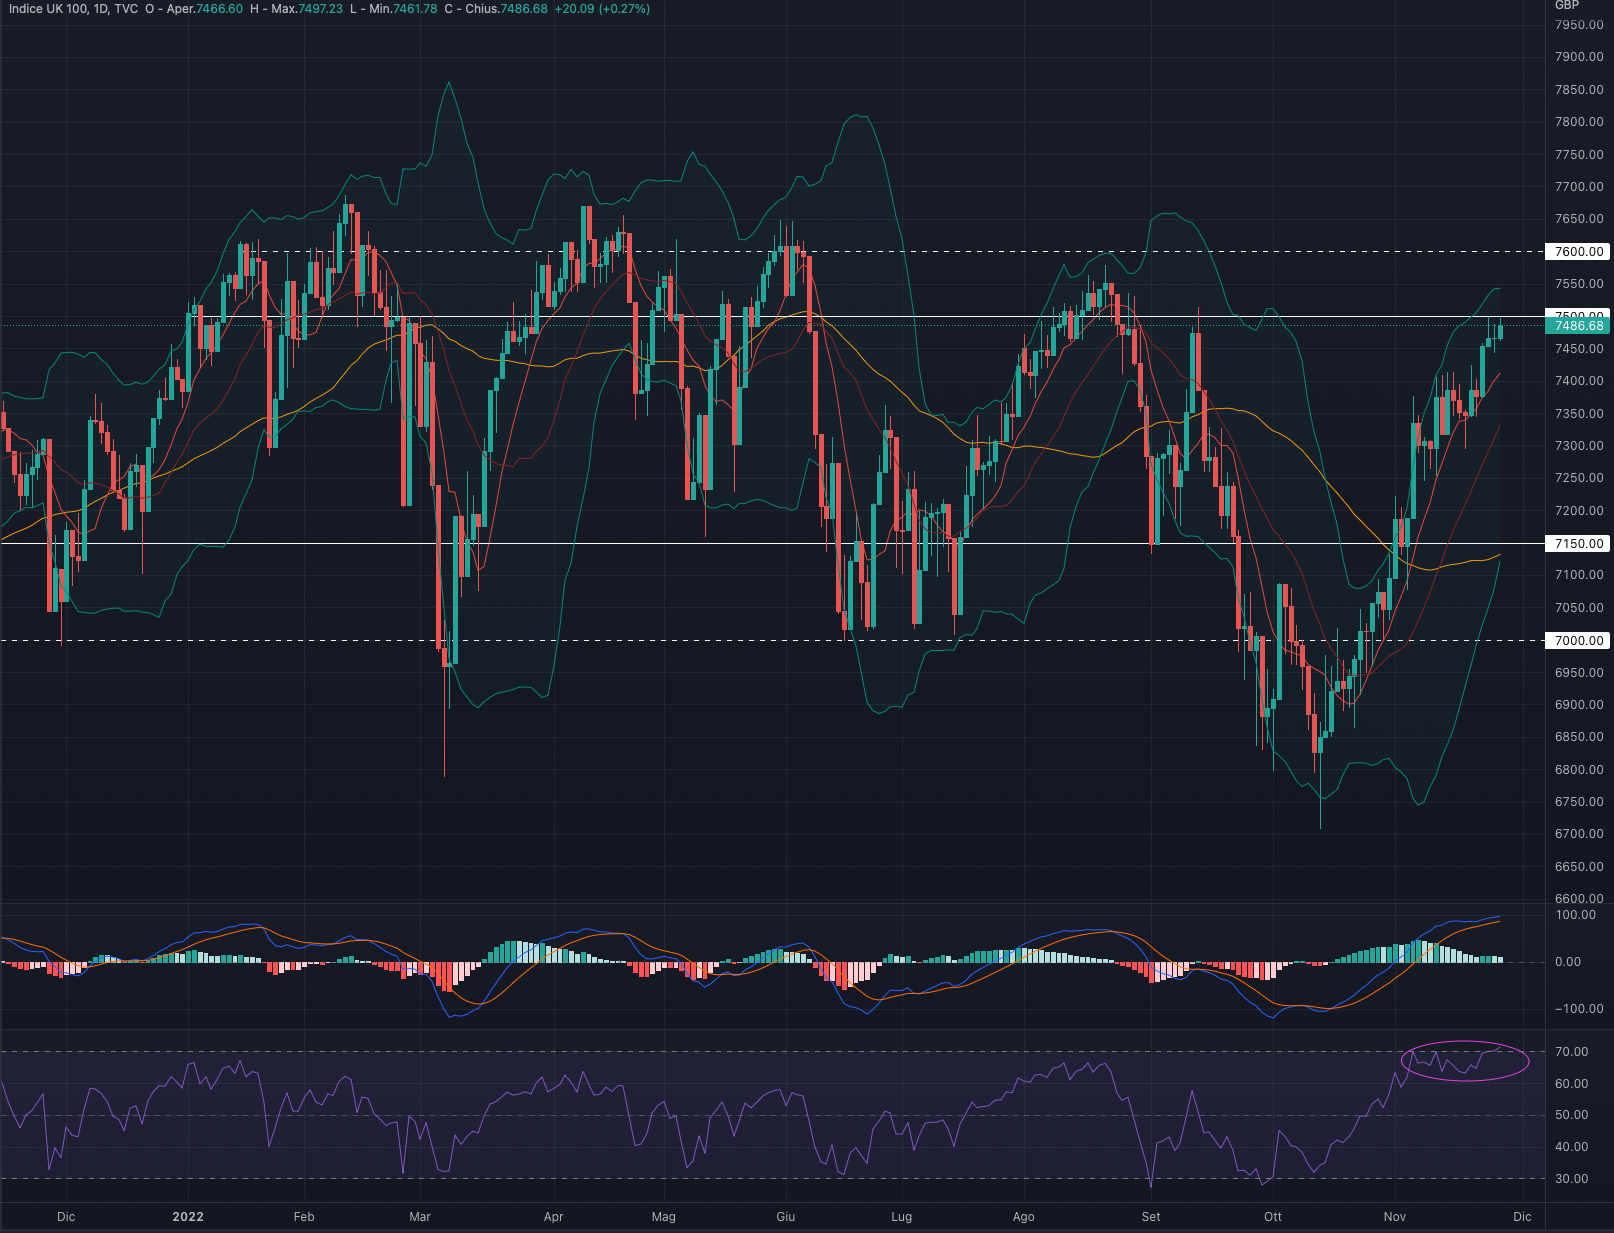
FTSE 100 (UKX)
The FTSE100 index had a week up by +1.37%.
For the week ahead we are in favour of a retracement in the area of 7,300.
Indicators
Positive week for the British index which sees the price keep moving near the strong August levels'.
Despite another week to the upside, we believe that the risk/reward on the UKX is now heavily biased in favour of short-medium term declines. We believe there are two aspects in favour of this thesis: the first is the price action, where we can see that throughout 2022 the FTSE 100 has been on a wide horizontal channel between 7,000 - 7,600.
Second aspect are the internal indicators: MACD and RSI are now very extended to the upside, the first sees a slowdown in the histograms and the RSI continues to remain in overbought territory.
Combining price action and internal indicators we can see that at current levels, the UK index has more often moved downwards rather than a repeated rise.
We are bearish on the FTSE 100 and waiting for substantial downside before considering long setups.
Support at 7,150.
Resistance at 7,500.
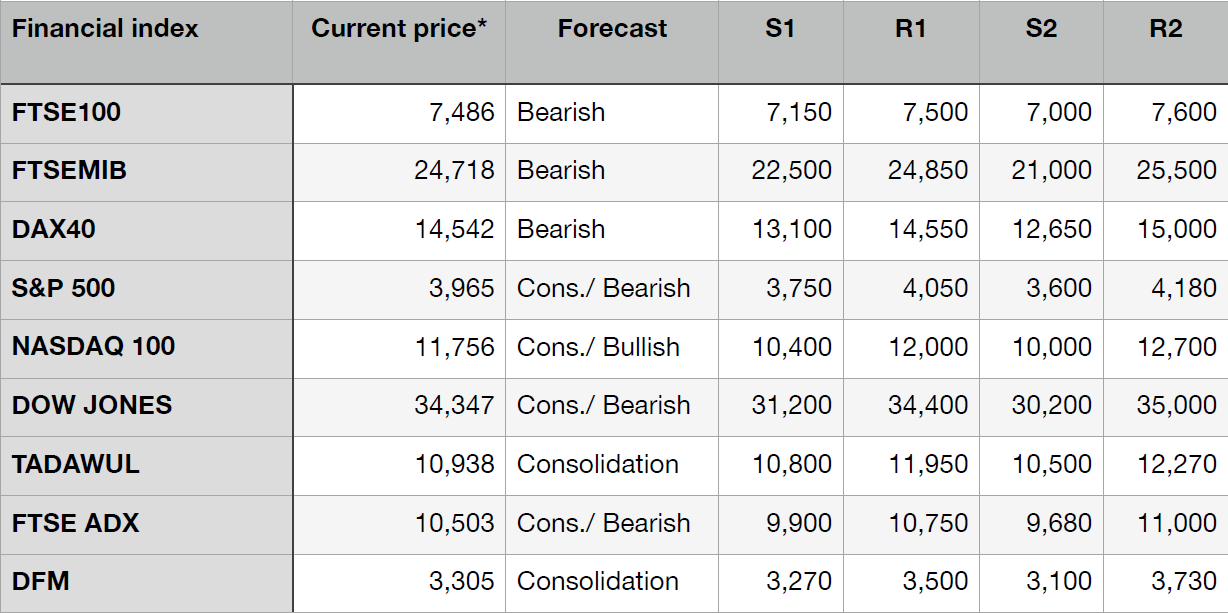
| Current price | Forecast | S1 | R1 | S2 | R2 |
| 7,486 | Bearish | 7,150 | 7,500 | 7,000 | 7,600 |
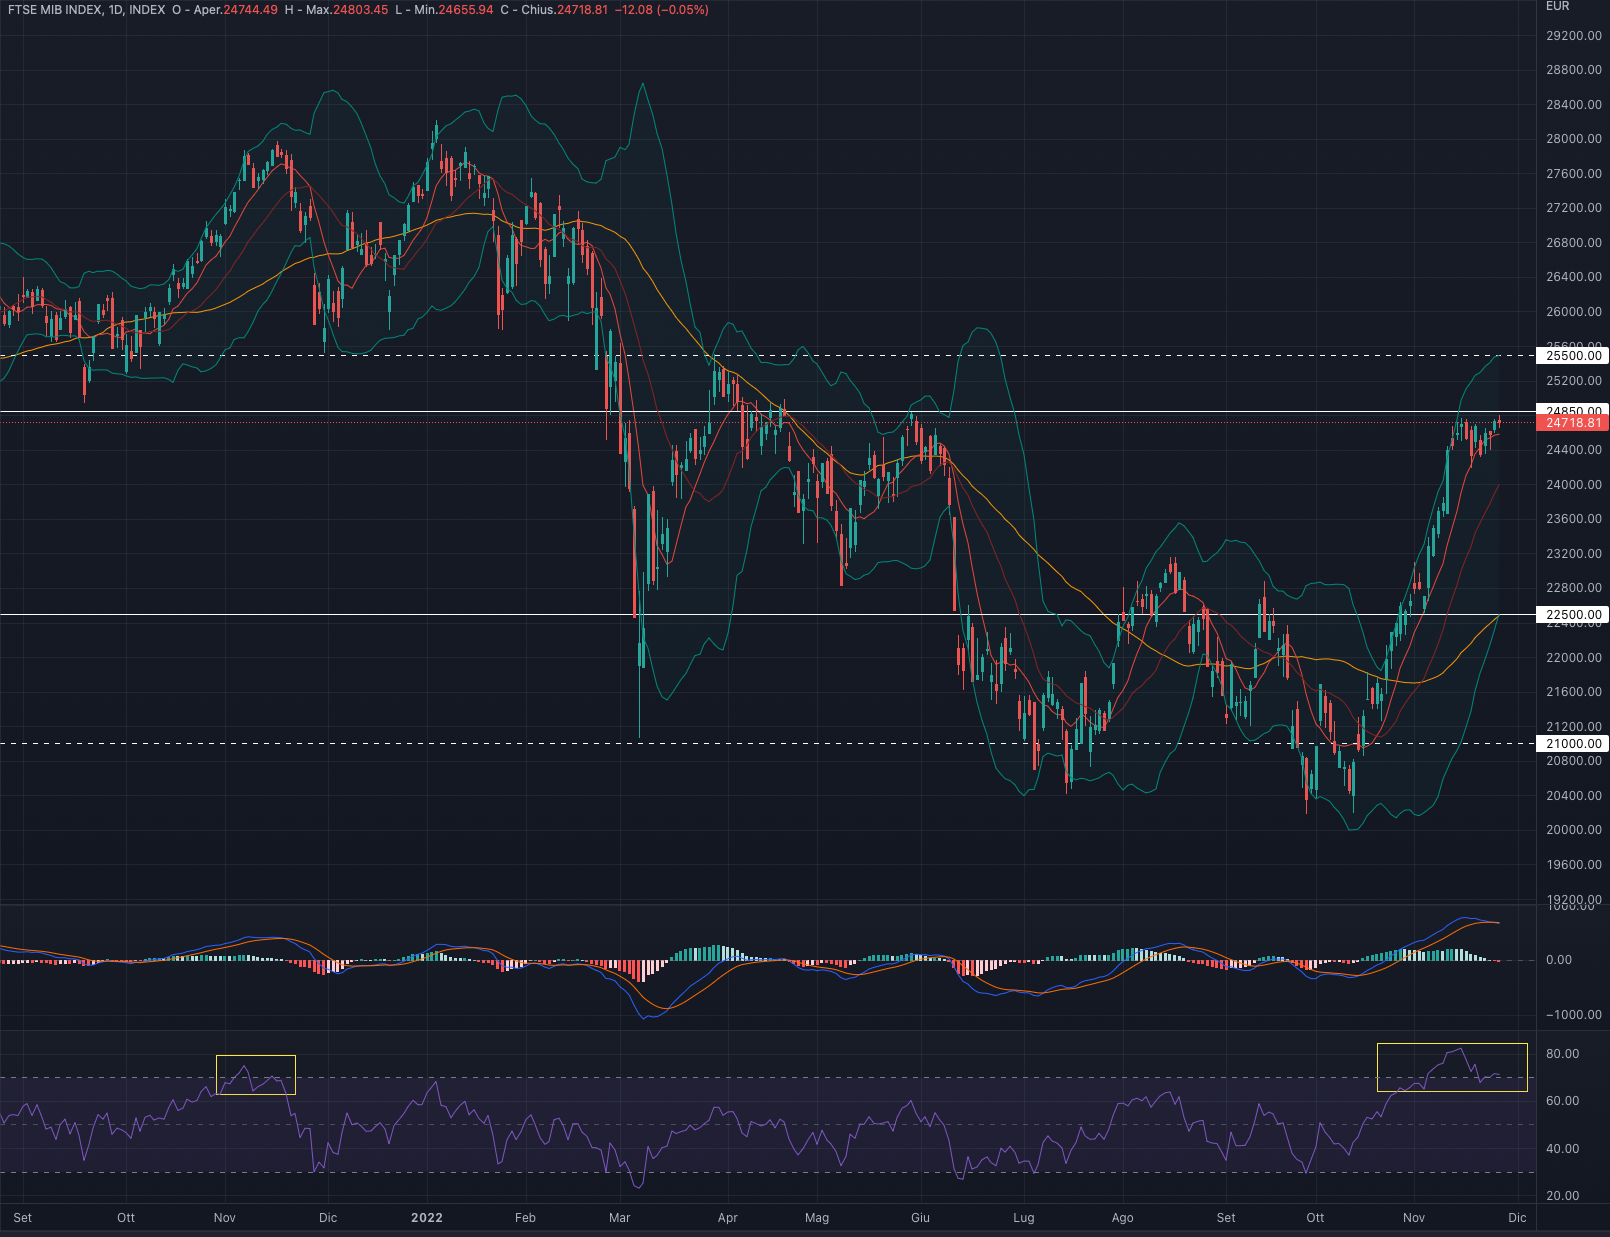
FTSEMIB (FTSEMIB)
The FTSEMIB index had a week up by +0.18%.
For the week ahead we favour a retracement to the 23,300 - 23,500 area.
Indicators
Positive week for the FTSEMIB which continues to stay near the strong area of 24,850.
If in the medium-long term these last move upwards are certainly positive, in the short term we believe that the price is now very extended to the upside and that it may need significant reversals before keep proceeding upwards.
MACD and RSI are very extended with the latter in particular in overbought territory (a scenario that has not happened since November 2021 which was followed by strong declines).
We are bearish on the FTSEMIB as we believe the overextension in price and internal indicators shift the weight in favour of retracements rather than repeated upside.
The index is now far from all the main moving averages making the surrounding scenario unstable and subject to significant reversals.
Support at 22,500.
Resistance at 24,850.
| Current price | Forecast | S1 | R1 | S2 | R2 |
| 24,718 | Bearish | 22,500 | 24,850 | 21,000 | 25,500 |
DAX 40 (DAX)
The DAX index had a week up +0.76%.
We are in favor of a progressive retracement to 13,800 for the week ahead.
Indicators
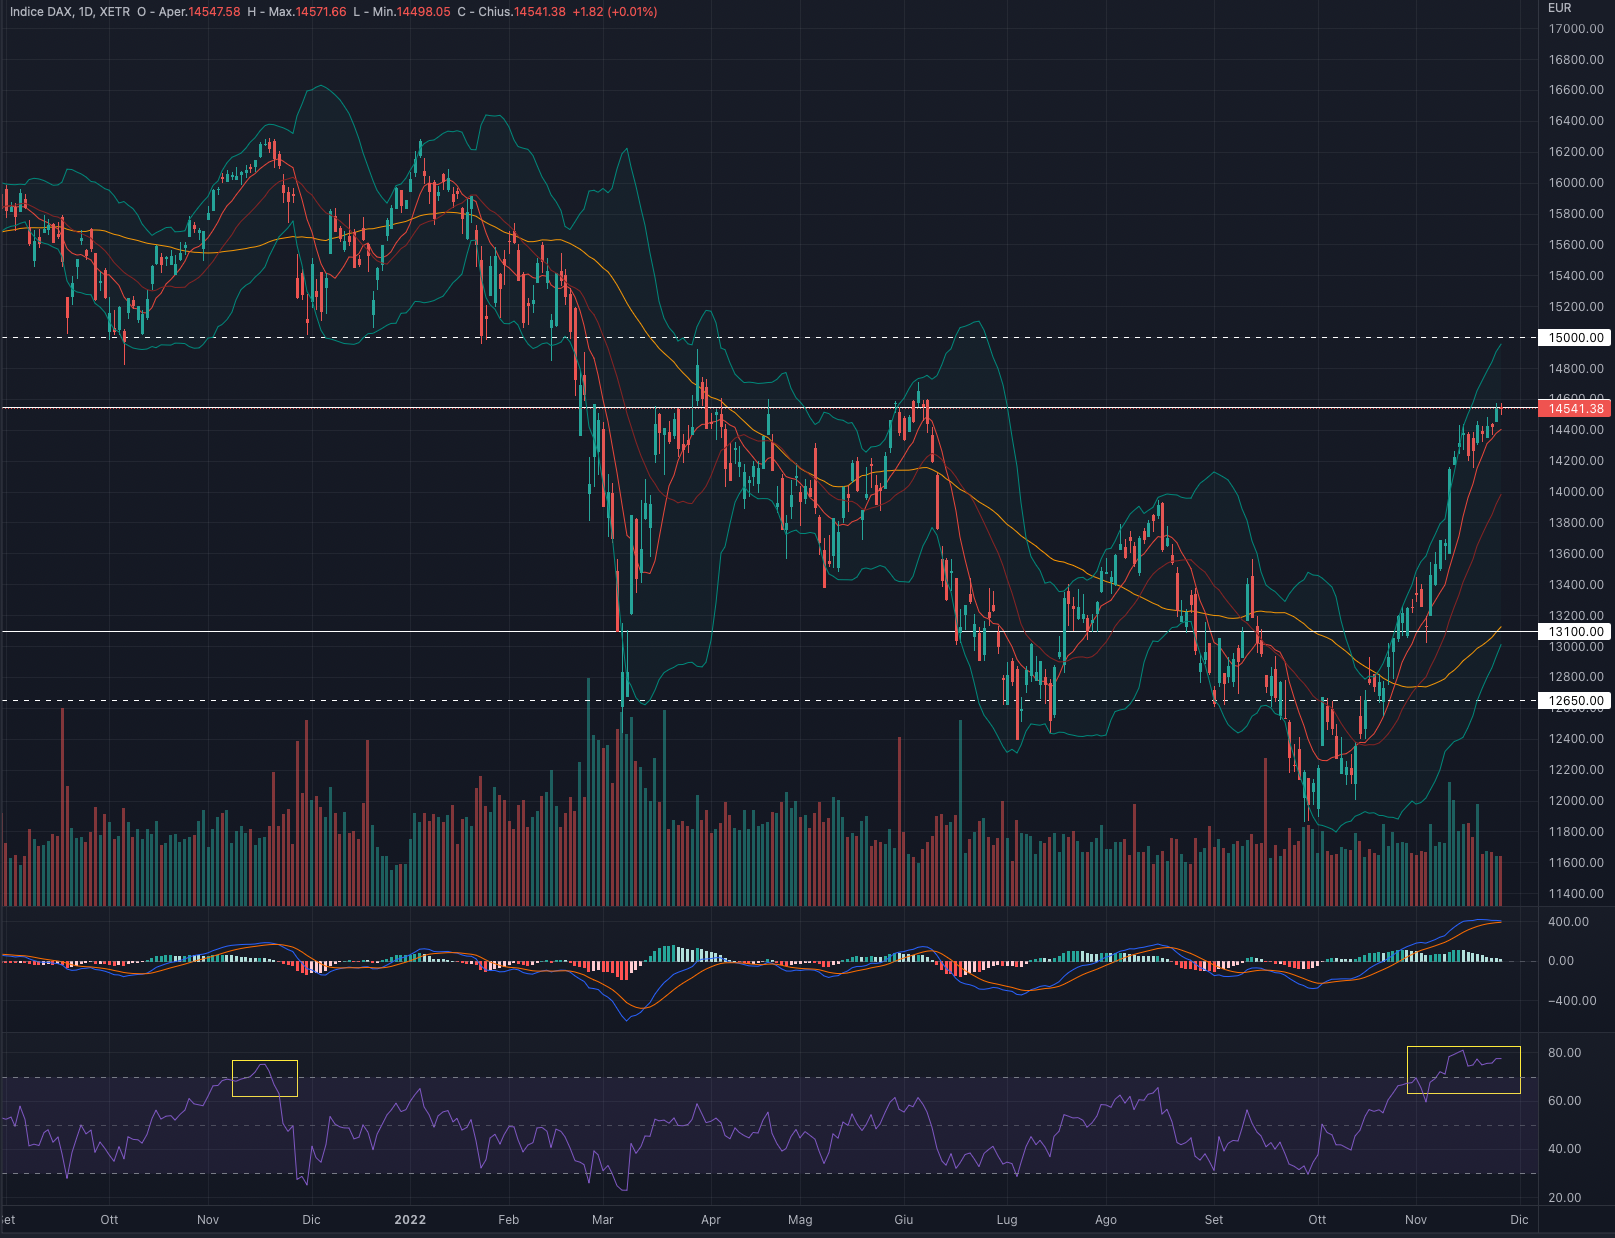
Positive week for the German index which keeps the price close to the resistance level at 14,550 respecting the horizontal channel in place since February-March 2022.
MACD and RSI are now very extended to the upside with the latter in the overbought area: this aspect radically shifts the risk/reward in favour of possible short-term downsides.
In order for the price to proceed higher, the internal indicators would have to retrace first.
Looking at previous price action, this tend to turned around once it reached such levels in MACD and RSI. We believe that this situation is no different from the previous ones.
We see a possible retracement area at 13,600, not excluding a stronger drop to 13,100.
We are bearish on the DAX and in favour of possible short-term reversals.
Support at 13,100.
Resistance at 14,550.
| Current price | Forecast | S1 | R1 | S2 | R2 |
| 14,542 | Bearish | 13,100 | 14,550 | 12,650 | 15,000 |
S&P 500 (SPX)
The S&P500 index had a week up by +1.53%.
For the week ahead we are in favour of a possible consolidation in the 3,800 - 3,900 area.
Indicators
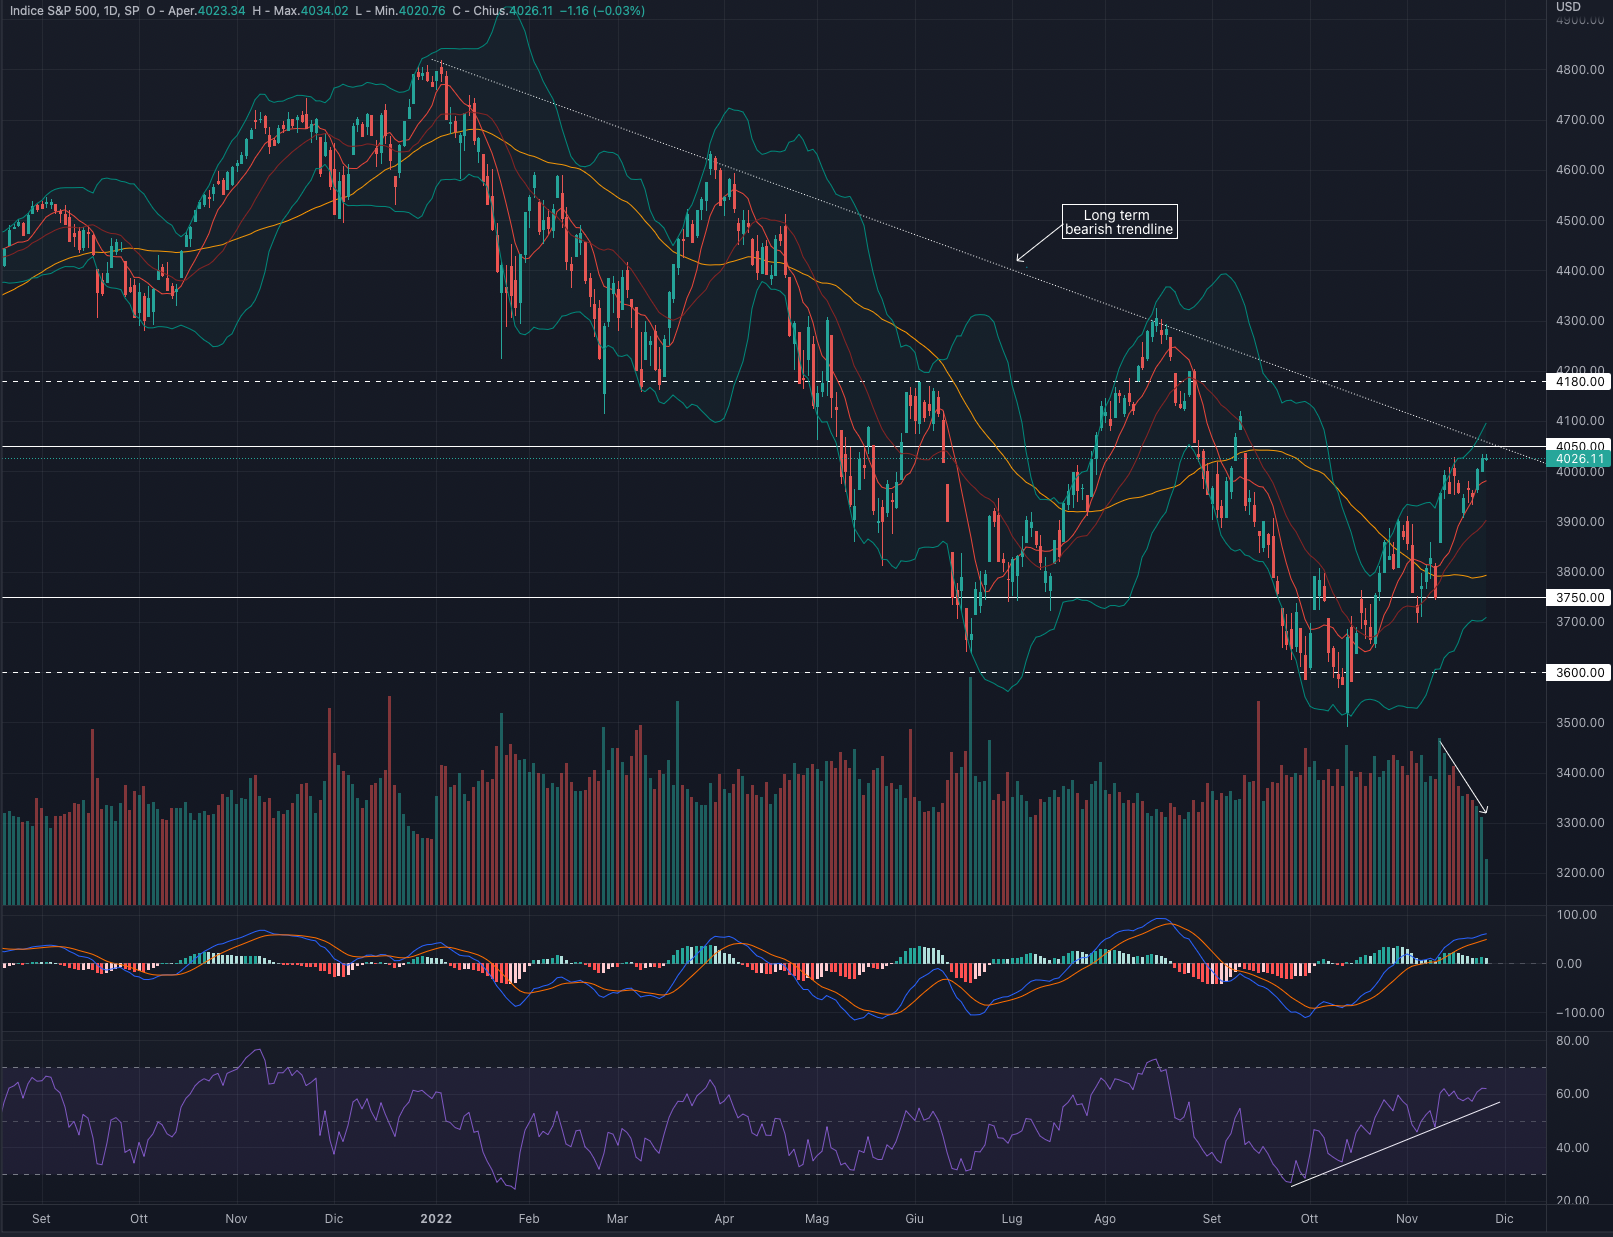
Week that keeps the SPX near the long bearish trendline started at the beginning of 2022.
In our opinion, the continuous lateral swings make the scenario very uncertain and unstable.The MACD and RSI internal indicators are and remain very extended to the upside, which combined with the strong downward trendline leave us skeptical about the possibility of further short-term increases.
We are neutral on the S&P 500: the surrounding scenario remains the one of a bear market and before being able to change course the obstacles are set to overcome 4,100 and then 4,300. We don't believe there is the necessary strength to be able to make extensions of this magnitude and therefore we prefer to wait for market reversals.
Support at 3,750.
Resistance at 4,050.
| Current price | Forecast | S1 | R1 | S2 | R2 |
| 3,965 | Cons/Bearish | 3,750 | 4,050 | 3,600 | 4,180 |
Nasdaq100 (NDX)
The NASDAQ 100 index had a week up by +0.68%.
For the week ahead we favour a consolidation in the 11,200 - 11,600 area.
Indicators
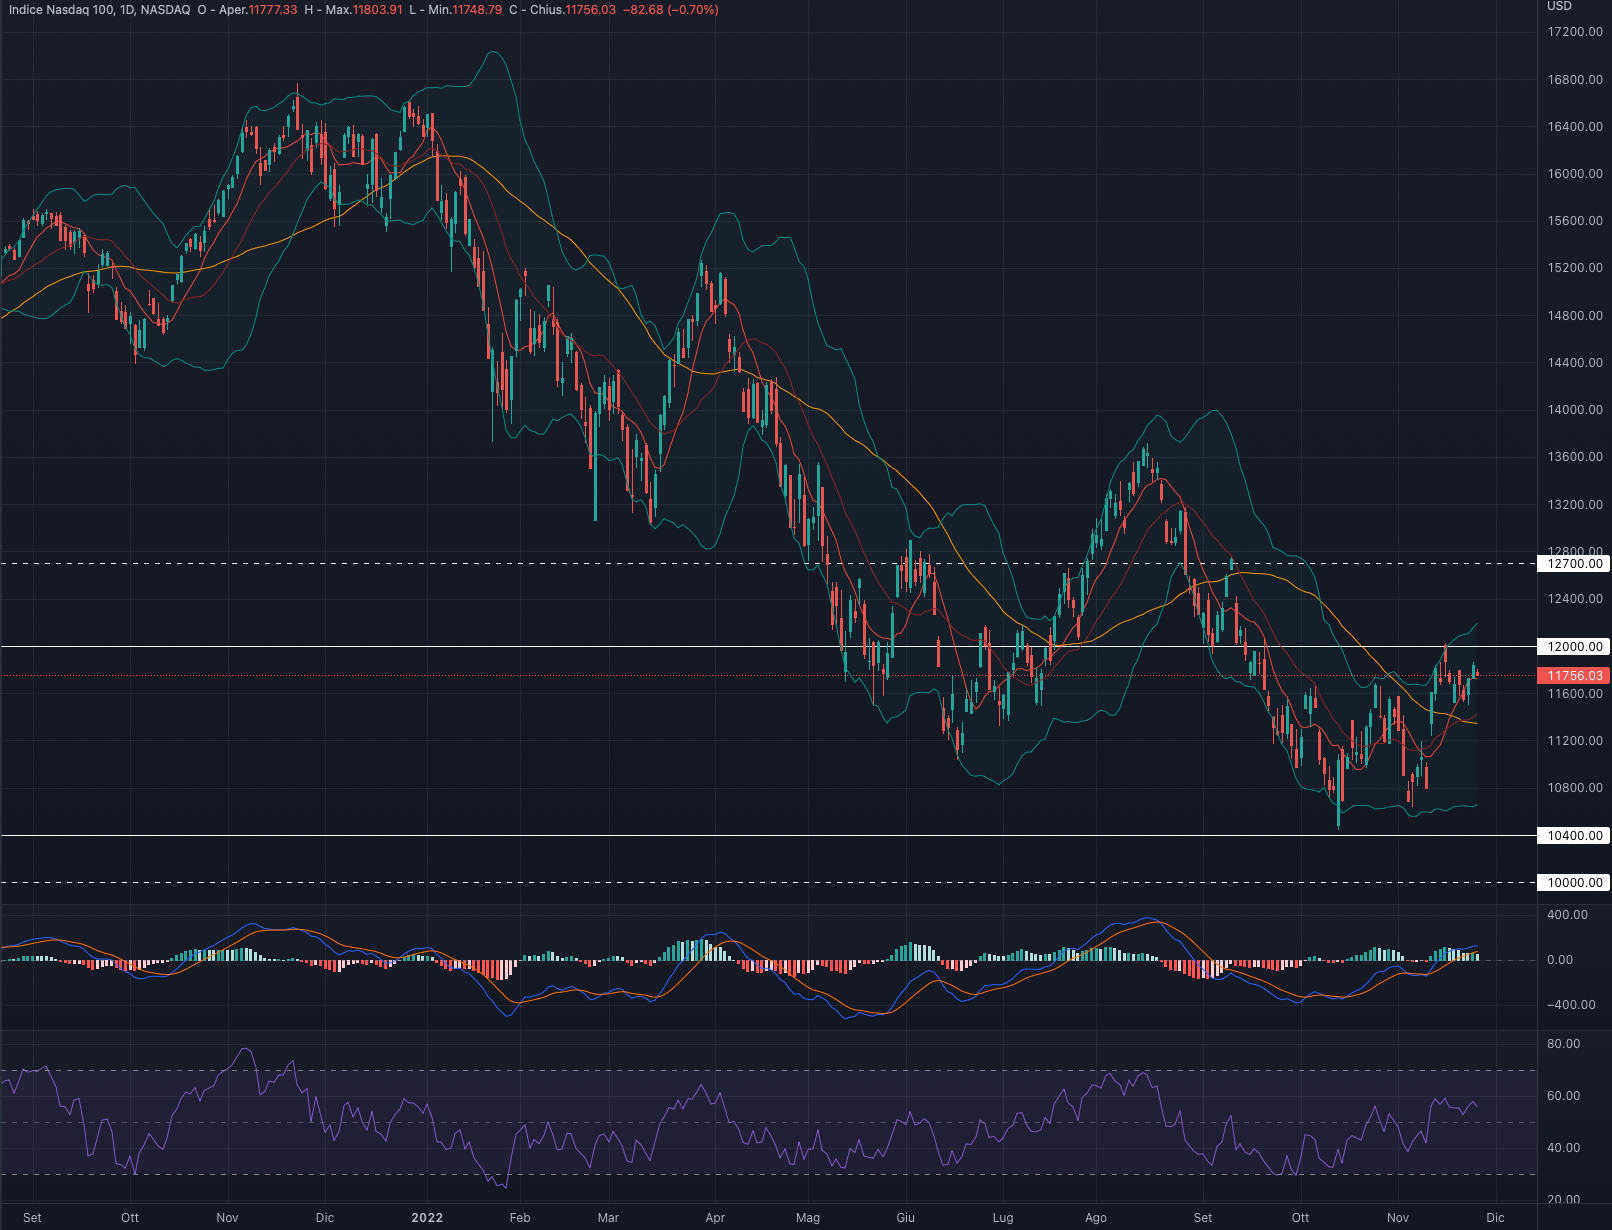
Consolidation week for the Tech index which brings the price back into the narrow trading range 11,800-11,600.
The continued stay above the 50-day moving average (yellow line) is certainly a positive medium-term indicator, creating the possibility for an upward continuation.
MACD and RSI are recovering but at the same time reflecting the ongoing consolidation, having been flat since mid-November.
We are positive on the NASDAQ 100 however we prefer to wait for price confirmations. Looking forward to a consolidation above 11,800: once surpassed, we see 12,000 and 12,700 as short to medium term targets.
It is important to note that a break of 11,600 could lead to a rapid drop to 11,200.
Support at 10,400.
Resistance at 12,000.
| Current price | Forecast | S1 | R1 | S2 | R2 |
| 11,756 | Cons/Bullish | 10,400 | 12,000 | 10,000 | 12,700 |
Dow Jones (DJI)
The DOW JONES index had a week up by +1.78%.
For the week ahead we favour an initial retracement to the 33,500 area.
Indicators
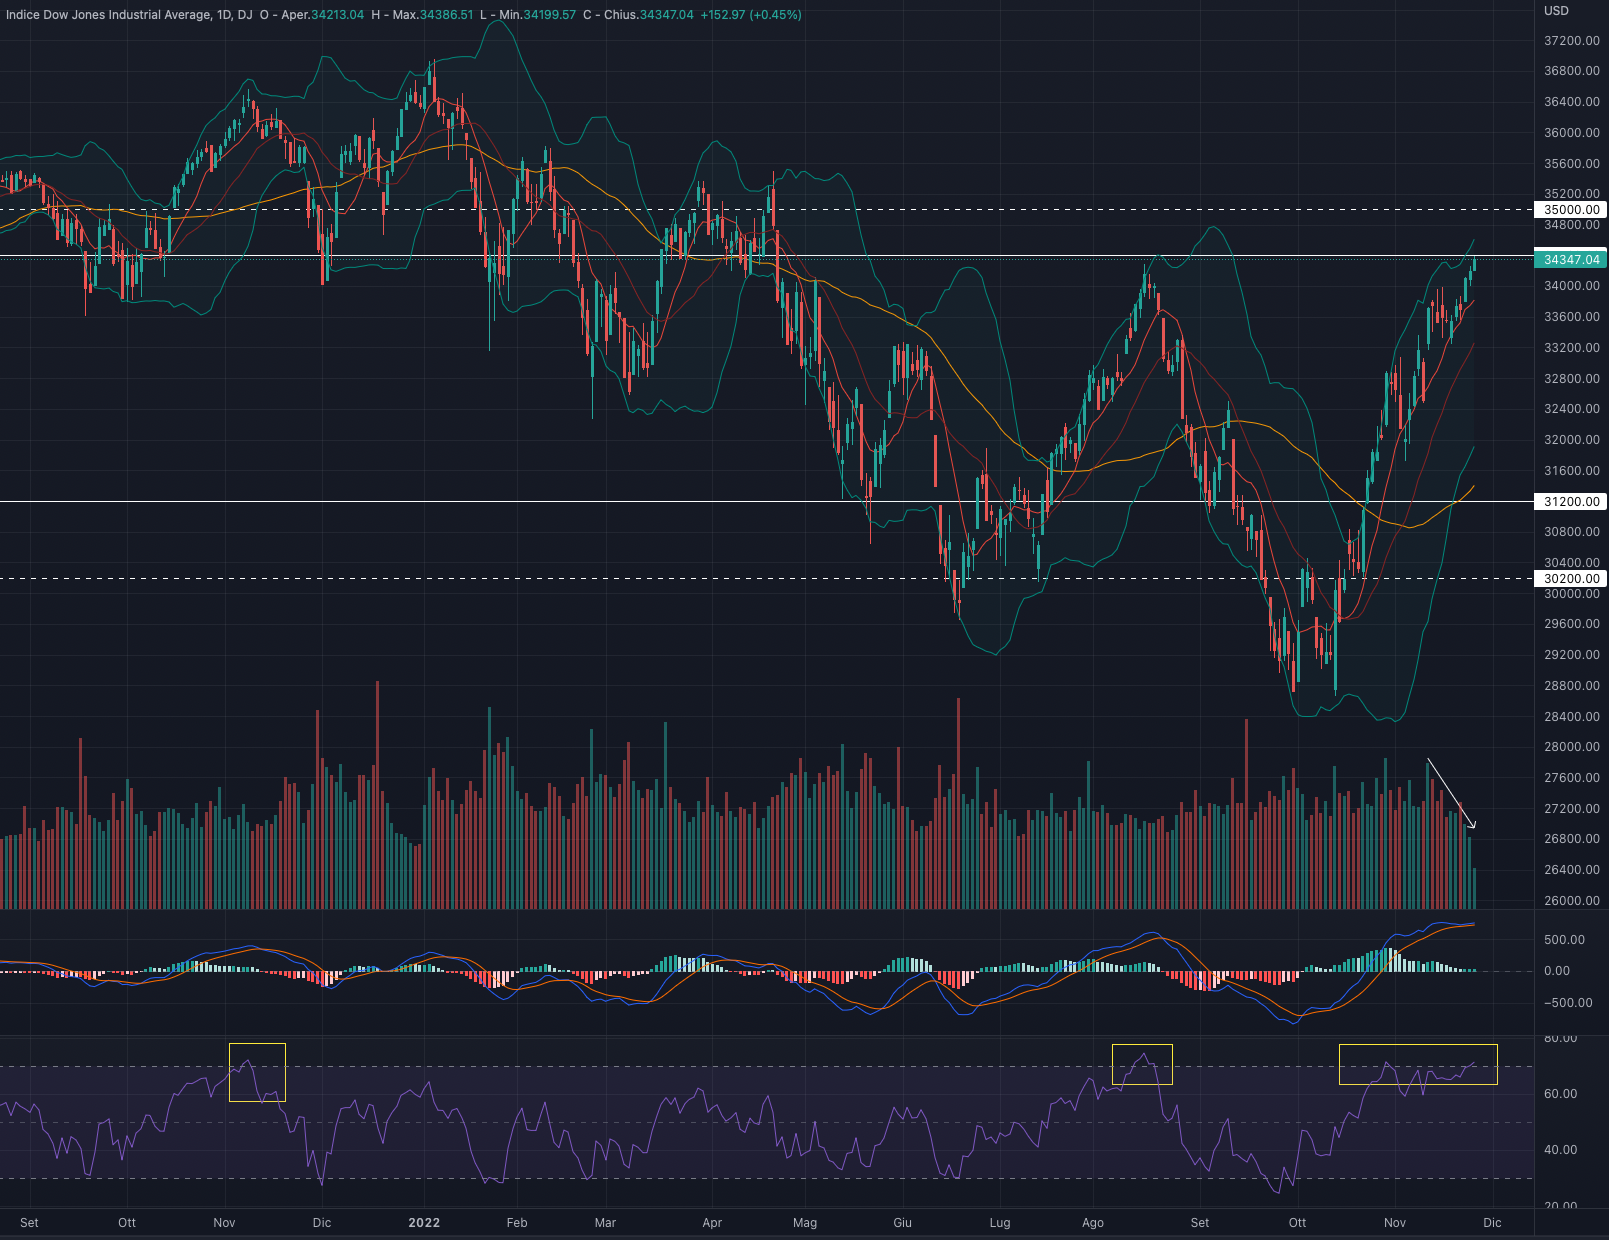
Week that keeps the index at the August levels'.
MACD and RSI are now very extended to the upside with the latter in overbought territory.
As happened before, the strong distance from the 50 MA 50 (yellow line) keeps us cautious on the latest upward moves. We believe there is a fair chance of a retracement at least close to the 50-day moving average, ie around 31,000 - 31,500.
A further element of caution is the decrease in volumes from mid-November to today, as a continuation of the bullish trend should be supported by increasing volumes. rather than decreasing ones.
We are bearish the DOW JONES given the strong upside extension. We prefer to wait for a slowdown in internal indicators, a reconciliation with the main moving averages and a better correlation with volumes.
Support at 31,200.
Resistance at 34,500.
| Current price | Forecast | S1 | R1 | S2 | R2 |
| 34,347 | Cons/Bearish | 31,200 | 34,400 | 30,200 | 35,000 |
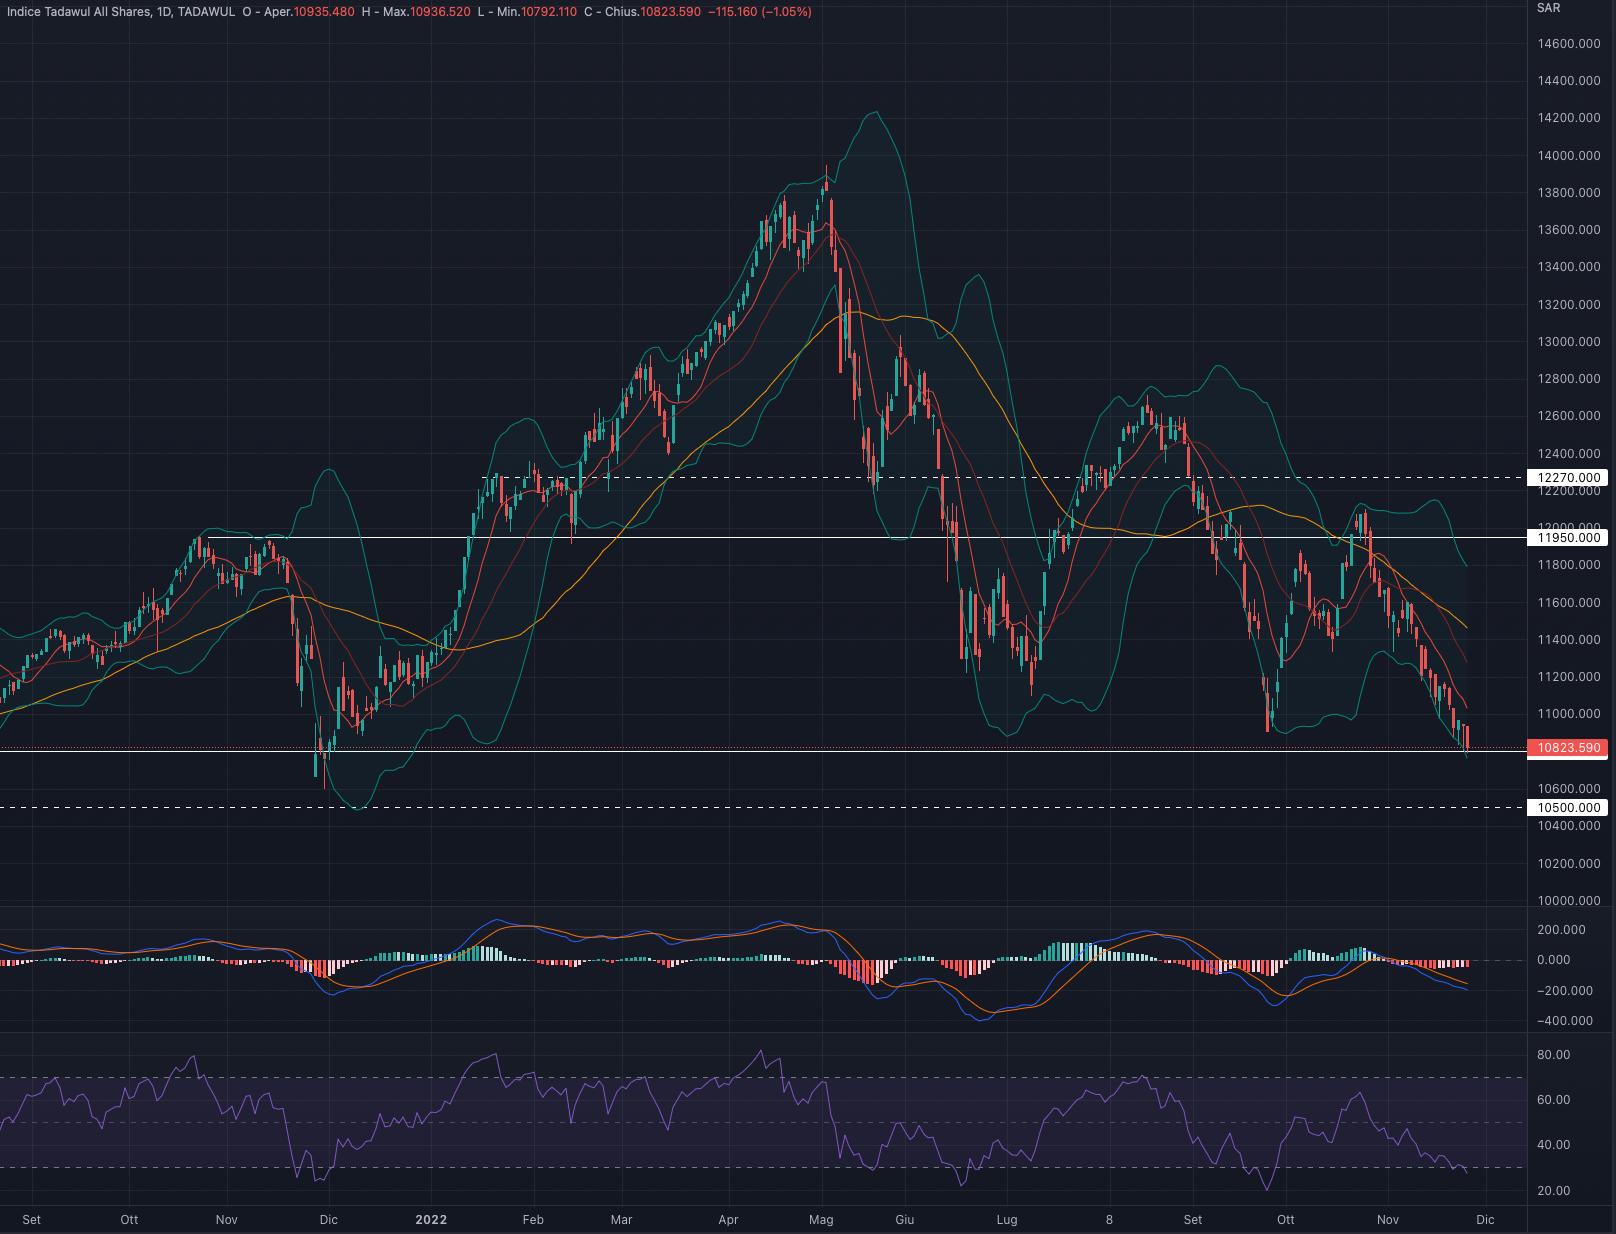
TADAWUL (TASI)
TADAWUL index had a week down by -1.15%.
We are in favour of consolidation in the area of SAR 10,700 - 10,900 for the week ahead.
Indicators
Bearish week for the Saudi index which is now testing the strong support at 10,800.
As happened in November 2021, the strong distance from the 50-day moving average (yellow line) could suggest a possible short-term recovery. At the same time it is important to stress that the first obstacle to overcome remains the 9MA (red line), which has played the role of dynamic resistance in recent months.
MACD and RSI are very extended to the downside, decreasing the possibility of further medium-term downward moves.
At the moment we prefer to remain neutral on the Tadawul. The strong downside extension makes today's price action very interesting, at the same time we believe it is worth waiting for a consolidation followed by a price reversal above at least the 11,000 level.
Support at 10,800.
Resistance at 11,950.
| Current price | Forecast | S1 | R1 | S2 | R2 |
| 10,938 | Cons/Bearish | 10,800 | 11,950 | 10,500 | 12,270 |
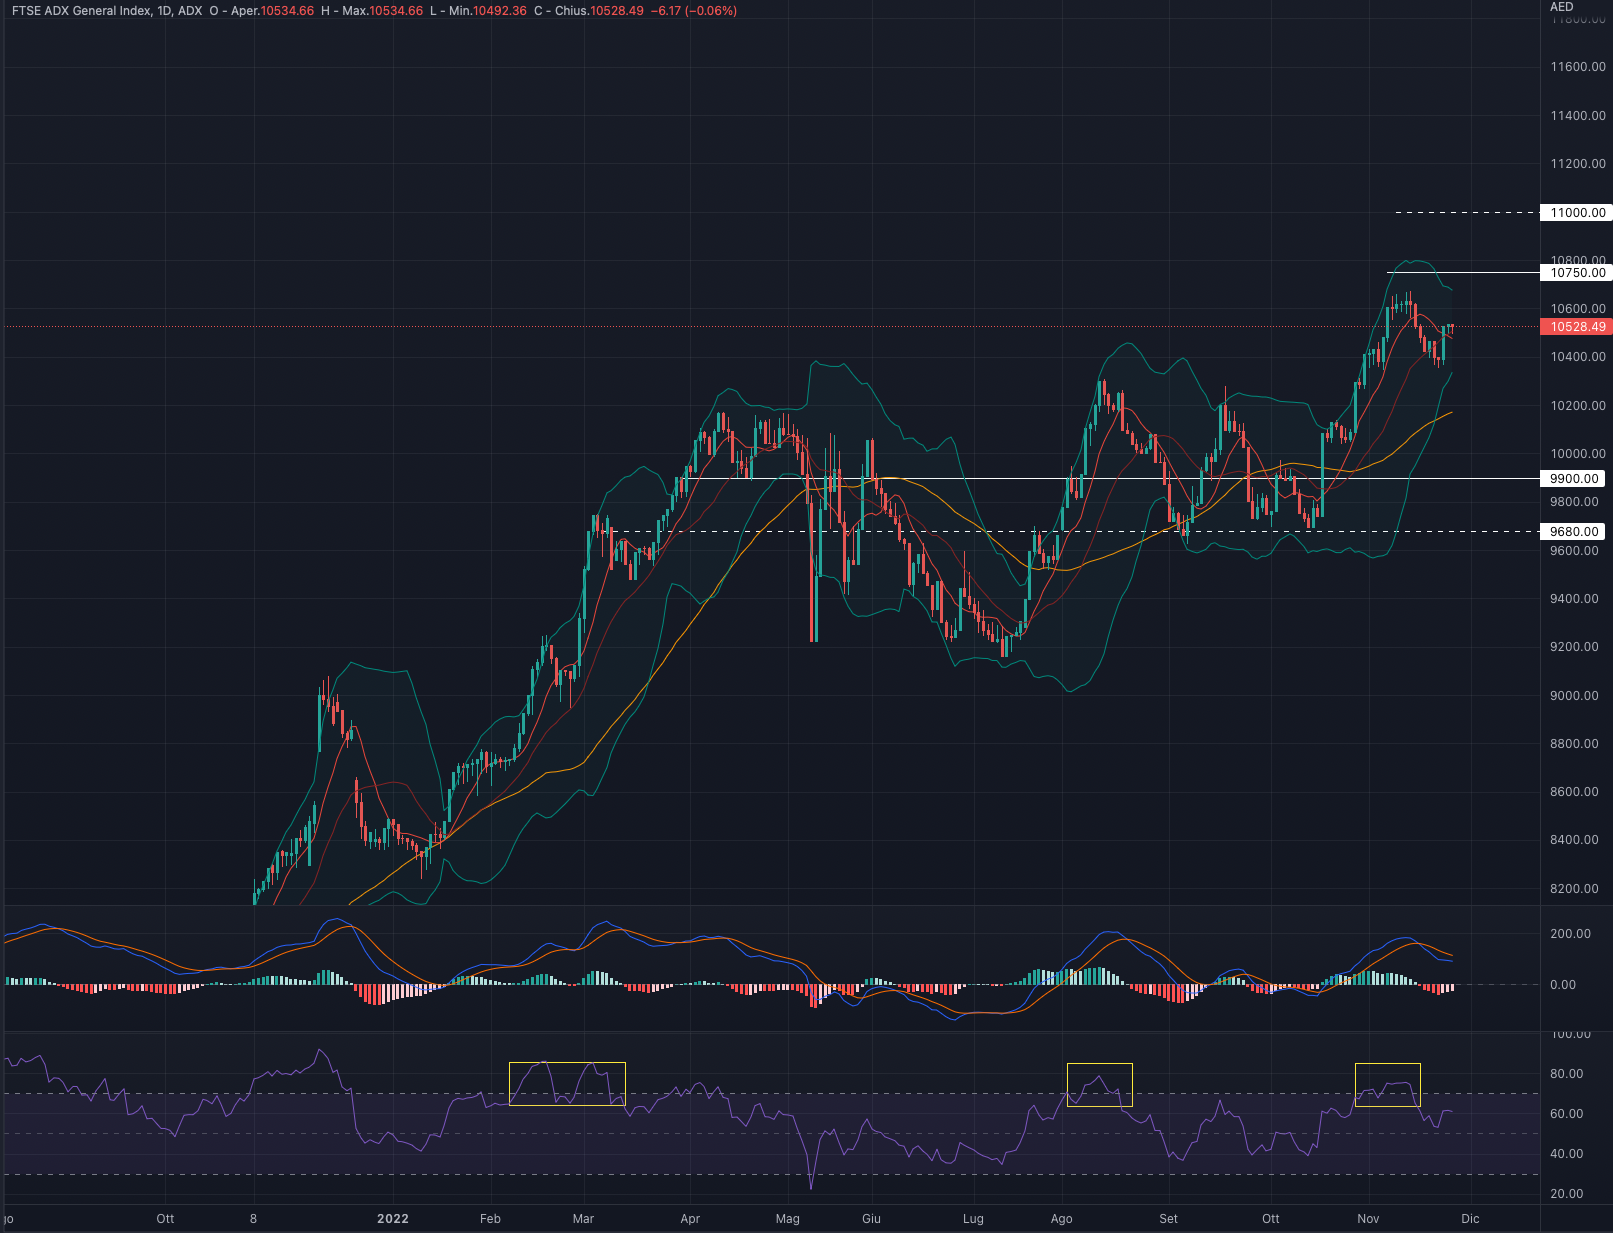
FTSE ADX GROWTH MARKET INDEX (FADGI)
FTSE ADX index had a week up by +0.60%.
For the week ahead we favour a consolidation in the 10,300-10,400 area.
Indicators
A week that we believe can only mark a first initial reversal after the strong extensions of recent months.
MACD and RSI remain extended to the upside shifting the risk/reward in favour of possible downsides rather than repeated up ward moves.
At the moment we prefer to remain neutral on the FTSE ADX, the strong upside extension is positive from a medium to long-term perspective. At the same time, before evaluating long setups, we believe it is appropriate to wait for the price to stabilise: a return to the 10,200-10,300 area could be a backtest area and a possible long positioning.
Support at 9,900.
Resistance at 10,750.
| Current price | Forecast | S1 | R1 | S2 | R2 |
| 10,503 | Cons/Bearish | 9,900 | 10,750 | 9,680 | 11,000 |
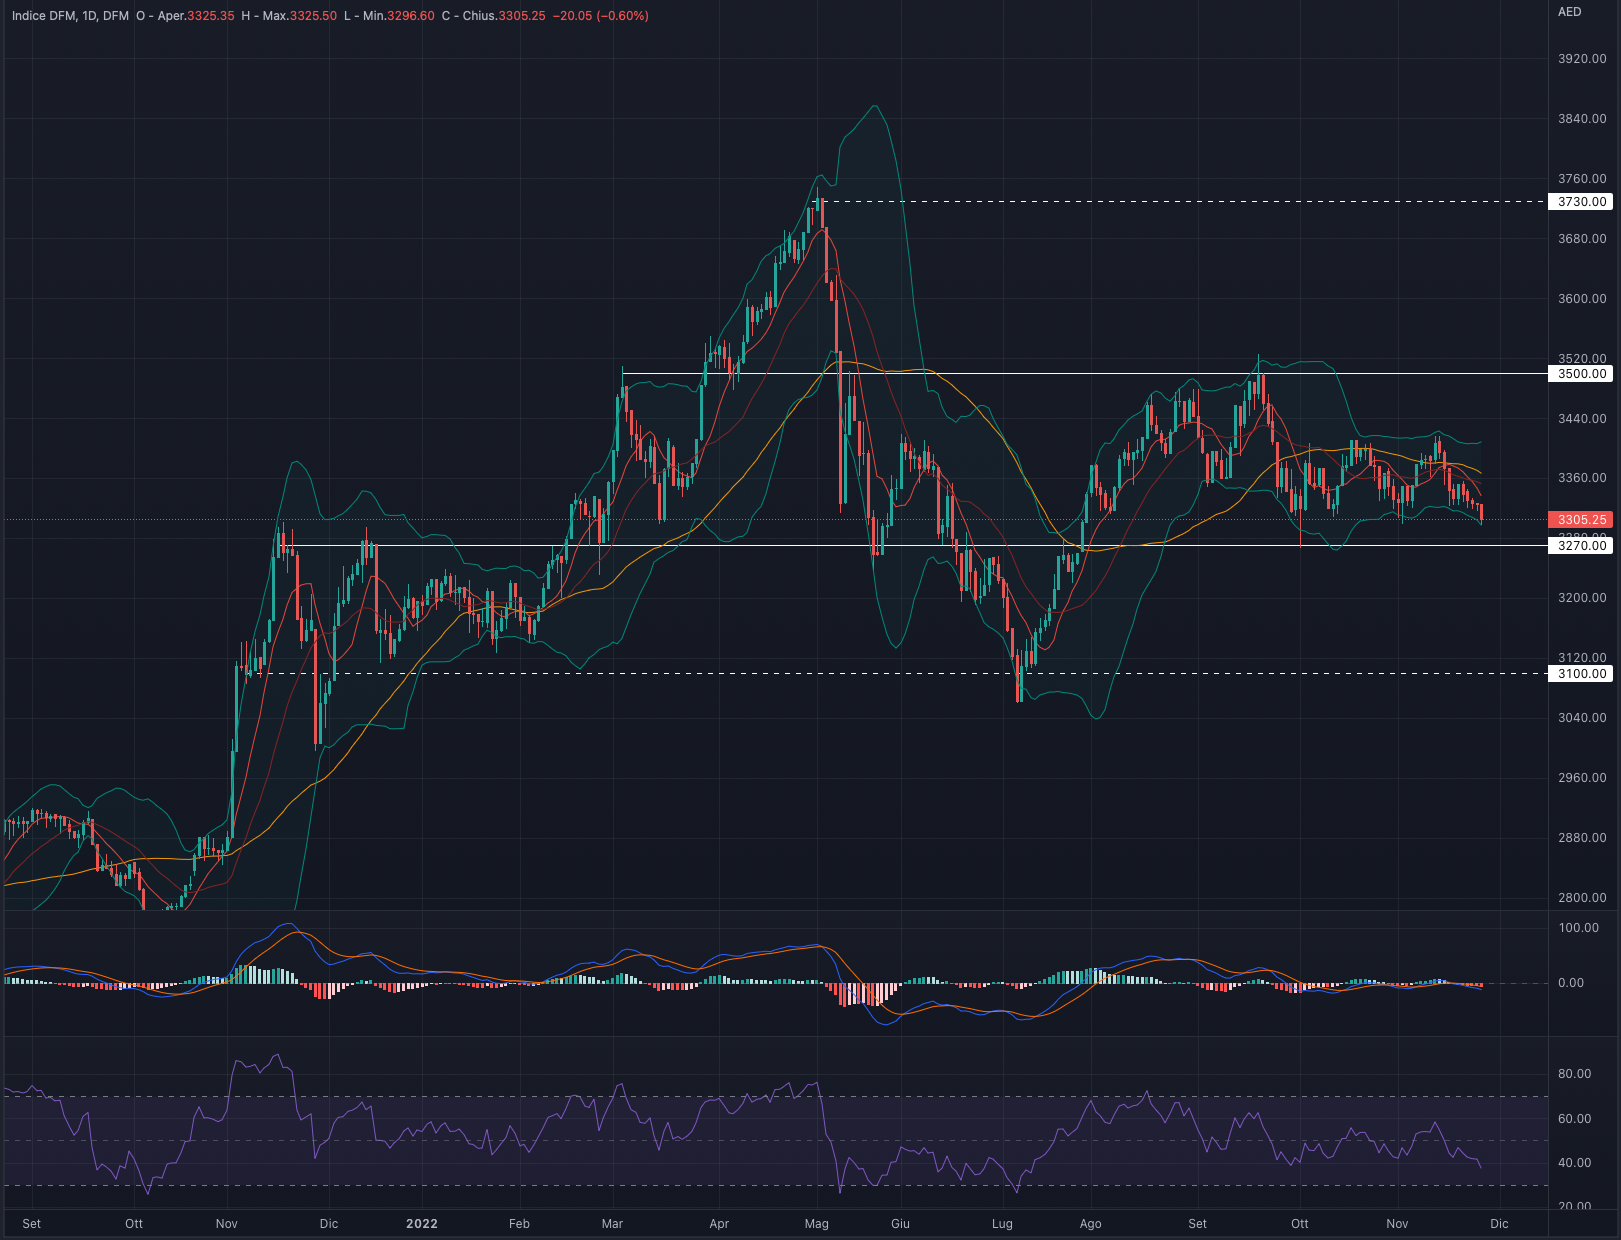
DUBAI FINANCIAL MARKET GENERAL INDEX (DFMGI)
DFM index had a week down by -1.40%.
For the week ahead we are in favour of consolidation in the 3,350 area.
Negative week for the DFM which seems to see the price break out of the most recent trading range.
Since mid-September, the index has continued to move within the same trading range of 3,300-3,400, giving no particular direction in the short to medium term.
MACD and RSI describe different scenarios: the former is substantially flat while the latter is very close to the oversold zone, from which it would be desirable to expect a price recovery.
We currently remain neutral on DFMGI waiting for a break of one of the two levels at 3,330 or 3,400.
Support at 3,270.
Resistance at 3,500.
| Current price | Forecast | S1 | R1 | S2 | R2 |
| 3,305 | Consolidation | 3,270 | 3,500 | 10,500 | 12,270 |
Author

Francesco Bergamini
OTB Global Investments
Francesco, BSc Finance and Msc in Business Management, graduated with Merit, is a professional with experience in the financial services industry and a keen interest in the financial markets.


