CSX Corp. (CSX) Stocks Elliott Wave technical analysis [Video]
![CSX Corp. (CSX) Stocks Elliott Wave technical analysis [Video]](https://editorial.fxsstatic.com/images/i/Economic-Indicator_Recession-5_XtraLarge.png)
CSX Elliott Wave Analysis Trading Lounge.
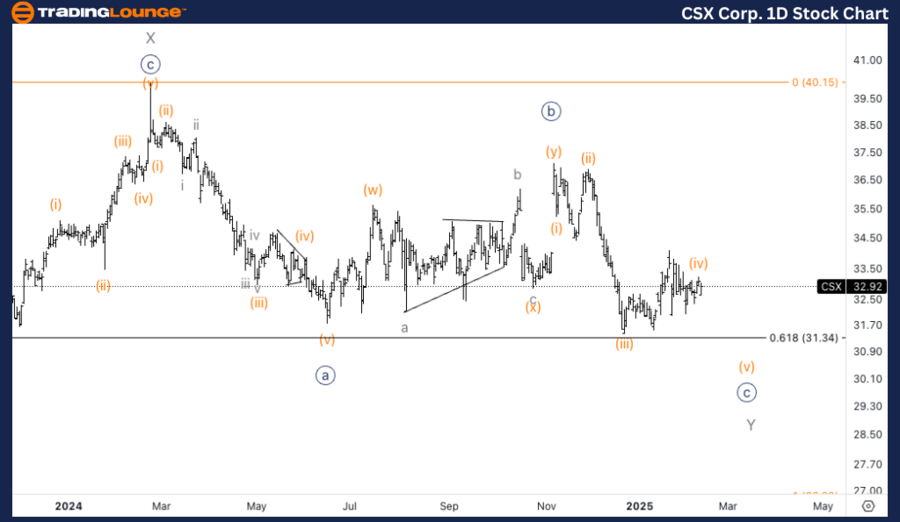
CSX Corp., (CSX) Daily Chart.
CSX Elliott Wave technical analysis
Function: Counter Trend.
Mode: Corrective.
Structure: Complex.
Position: Wave Y of (4).
Direction: Bottom into wave Y.
Details: Looking for completion into wave Y, to ideally break the bottom of wave {a} and reach equality of Y vs. W at 27$.
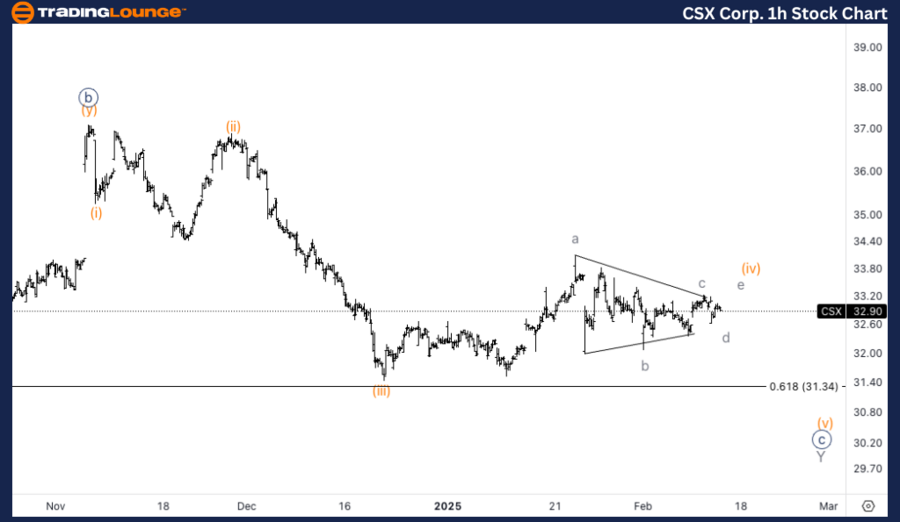
CSX Corp., (CSX) 1H Chart.
CSX Elliott Wave technical analysis
Function: Counter Trend.
Mode: Corrective.
Structure: Complex.
Position: Wave (iv) of {c}.
Direction: Downside into wave (v).
Details: Looking for further downside into wave (v) as we seem to be completing a triangle in wave (iv) right around MG2 of30$ at 32-33$.
This Elliott Wave analysis of CSX Corp., (CSX) outlines both the daily and 1-hour chart structures, highlighting the current trends and possible future price movements.
CSX Elliott Wave technical analysis – Daily chart
CSX Corp. (CSX) is currently in a complex corrective pattern, unfolding in wave Y of (4). This correction is expected to complete soon, potentially breaking the low of wave {a}. We are targeting a move down to the equality level of Y vs. W, which lies around $27, marking the potential bottom of this correction.
CSX Elliott Wave technical analysis – One-hour chart
On the 1-hour chart, CSX is approaching the final stages of a triangle formation in wave (iv) of {c}. We expect a further downside movement into wave (v) once this triangle completes. The price is hovering around the MG2 level at $32-33, and the next move should push lower, potentially marking the final leg of this corrective phase.
Technical analyst: Alessio Barretta.
CSX Elliott Wave technical analysis [Video]
Author

Peter Mathers
TradingLounge
Peter Mathers started actively trading in 1982. He began his career at Hoei and Shoin, a Japanese futures trading company.


