|

CSL Limited Elliott Wave technical forecast [Video]

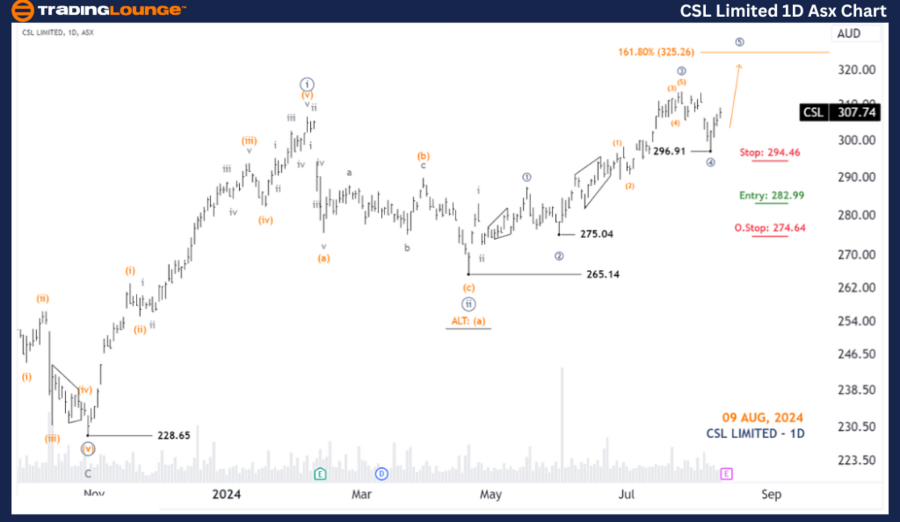
Greetings, Our Elliott Wave analysis today updates the Australian Stock Exchange (ASX) with CSL LIMITED – CSL. We see that CSL may be moving higher with wave ((iii))-navy.

ASX: CSL Elliott Wave technical analysis  

Function: Major trend (Minute degree, navy). 

Mode: Motive. 

Structure: Impulse.

Position: Wave ((5))-navy of Wave iii-grey of Wave ((iii))-navy. 

Details: Wave ((4))-navy has just ended and Wave ((5))-navy is unfolding to continue pushing higher. The previous Long Trade position is still performing well. 

Invalidation point: 296.91.

CSL one-day chart

CSL

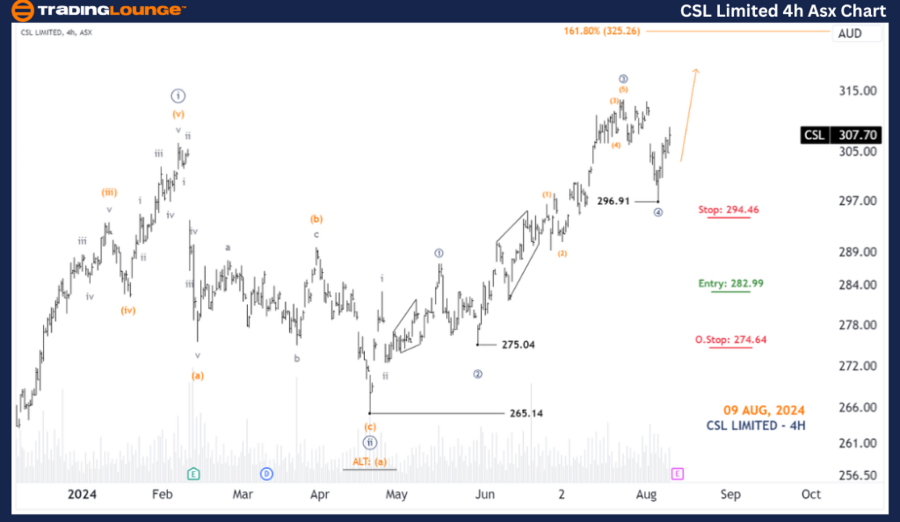
ASX: CSL four-hour chart analysis 

Function: Major trend (Minuette degree, orange). 

Mode: Motive.

Structure: Impulse.

Position:Wave((5))-navy of Wave iii-gray of Wave ((iii))-navy. 

Details: Wave ((4))-navy has just ended and Wave ((5))-navy is unfolding to continue pushing higher.I think it will continue to move towards the target around 320.00 - 325.26; while price must remain above the low of 296.91 to maintain this view.

Invalidation point: 296.91.

CSL

Conclusion

Our analysis, forecast of contextual trends, and short-term outlook for ASX: CSL LIMITED –CSL aims to provide readers with insights into the current market trends and how to capitalize on them effectively. We offer specific price points that act as validation or invalidation signals for our wave count, enhancing the confidence in our perspective. By combining& these factors, we strive to offer readers the most objective and professional perspective on market trends.

CSL Limited Elliott Wave technical forecast [Video]

Author

Peter Mathers

Peter Mathers

TradingLounge

Peter Mathers started actively trading in 1982. He began his career at Hoei and Shoin, a Japanese futures trading company.

More from Peter Mathers
Share:

Editor's Picks

EUR/USD weakens to near 1.1900 as traders eye US data

EUR/USD eases to near 1.1900 in Tuesday's European trading hours, snapping the two-day winning streak. Markets turn cautious, lifting the haven demand for the US Dollar ahead of the release of key US economic data, including Retail Sales and ADP Employment Change 4-week average.

GBP/USD stays in the red below 1.3700 on renewed USD demand

GBP/USD trades on a weaker note below 1.3700 in the European session on Tuesday. The pair faces challenges due to renewed US Dollar demand, UK political risks and rising expectations of a March Bank of England rate cut. The immediate focus is now on the US Retail Sales data. 

Gold sticks to modest losses above $5,000 ahead of US data

Gold sticks to modest intraday losses through the first half of the European session, though it holds comfortably above the $5,000 psychological mark and the daily swing low. The outcome of Japan's snap election on Sunday removes political uncertainty, which along with signs of easing tensions in the Middle East, remains supportive of the upbeat market mood. This turns out to be a key factor exerting downward pressure on the safe-haven precious metal.

Bitcoin Cash trades lower, risks dead-cat bounce amid bearish signals

Bitcoin Cash trades in the red below $522 at the time of writing on Tuesday, after multiple rejections at key resistance. BCH’s derivatives and on-chain indicators point to growing bearish sentiment and raise the risk of a dead-cat bounce toward lower support levels.

Dollar drops and stocks rally: The week of reckoning for US economic data

Following a sizeable move lower in US technology Stocks last week, we have witnessed a meaningful recovery unfold. The USD Index is in a concerning position; the monthly price continues to hold the south channel support.

Bitcoin Cash trades lower, risks dead-cat bounce amid bearish signals

Bitcoin Cash (BCH) trades in the red below $522 at the time of writing on Tuesday, after multiple rejections at key resistance. BCH’s derivatives and on-chain indicators point to growing bearish sentiment and raise the risk of a dead-cat bounce toward lower support levels.