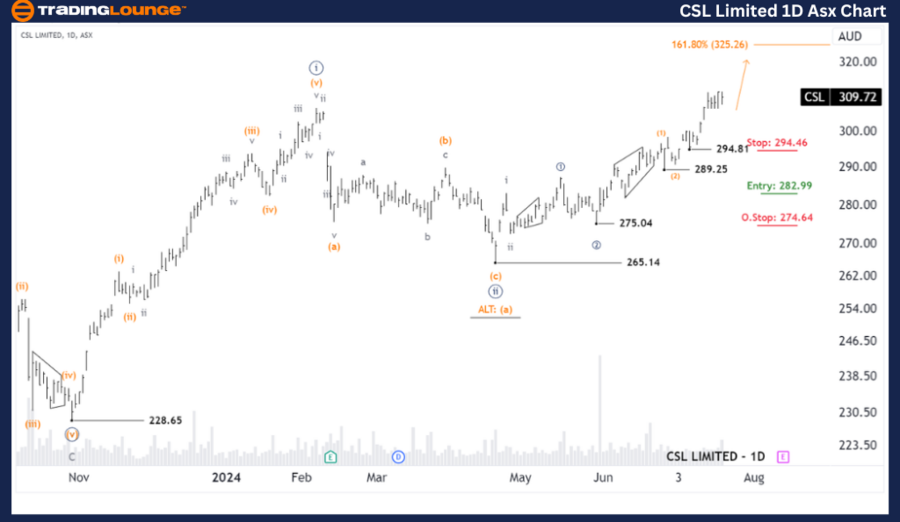
ASX: CSL Elliott Wave technical analysis (one-day chart)

Function: Major trend (Minute degree, navy).

Mode: Motive.

Structure: Impulse.

Position: Wave (3) - orange of Wave ((3)) - navy of Wave iii - gray of Wave ((iii)) - navy.

Details: Wave (3) - orange is advancing, targeting 325.26, with the requirement that the price stays above 294.81. This view holds as long as the price does not dip below this level. The Long Trade position in CSL has been profitable and is expected to continue growing.

Invalidation point: 294.81.

CSL

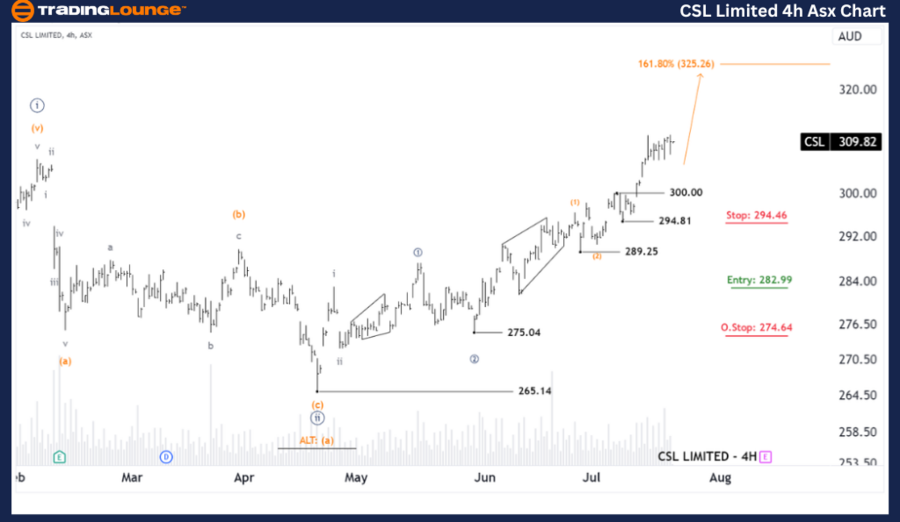
ASX: CSL Elliott Wave technical analysis (four-hour chart)

Function: Major trend (Minuette degree, orange).

Mode: Motive.

Structure: Impulse.

Position: Wave (3) - orange of Wave ((3)) - navy of Wave iii - gray of Wave ((iii)) - navy.

Details: Wave (3) - orange is still in an upward trajectory, aiming for 325.26, with the price needing to stay above 300.00 to maintain this outlook. The Long Trade position in CSL remains profitable and is poised for further gains.

Invalidation point: 300.00.

Chart

Conclusion

Our analysis provides a comprehensive forecast of CSL LIMITED – CSL’s market trends and short-term outlook. We highlight specific price points that act as validation or invalidation signals, bolstering confidence in our wave count. By integrating these elements, we offer an objective and professional perspective on market trends.

CSL Limited Elliott Wave technical forecast [Video]

Share: Feed news

As with any investment opportunity there is a risk of making losses on investments that Trading Lounge expresses opinions on.

Historical results are no guarantee of future returns. Some investments are inherently riskier than others. At worst, you could lose your entire investment. TradingLounge™ uses a range of technical analysis tools, software and basic fundamental analysis as well as economic forecasts aimed at minimizing the potential for loss.

The advice we provide through our TradingLounge™ websites and our TradingLounge™ Membership has been prepared without considering your objectives, financial situation or needs. Reliance on such advice, information or data is at your own risk. The decision to trade and the method of trading is for you alone to decide. This information is of a general nature only, so you should, before acting upon any of the information or advice provided by us, consider the appropriateness of the advice considering your own objectives, financial situation or needs. Therefore, you should consult your financial advisor or accountant to determine whether trading in securities and derivatives products is appropriate for you considering your financial circumstances.

Recommended content


Recommended content

Editors’ Picks

GBP/USD flirts with weekly low below 1.2950 after UK Retail Sales

GBP/USD flirts with weekly low below 1.2950 after UK Retail Sales

GBP/USD is testing weekly lows below 1.2950 in the early European session on Friday. The pair stays on the back foot after disappointing UK Retail Sales data amid the extended US Dollar recovery. The focus now shifts to the Fedspeak. 

GBP/USD News

EUR/USD holds losses near 1.0900 amid sustained US Dollar recovery

EUR/USD holds losses near 1.0900 amid sustained US Dollar recovery

EUR/USD remains in the red near 1.0900 in European trading on Friday. The sustained US Dollar rebound amid risk-aversion and firmer US Treasury bond yields weighs on the pair. ECB policy decision fails to lift the Euro. Fedpseak remains on tap later in the day. 

EUR/USD News

Gold price tests multi-day low, Fedspeak eyed

Gold price tests multi-day low, Fedspeak eyed

Gold price corrects further from the record high amid some follow-through USD buying. September Fed rate cut bets should cap the USD and help limit losses for the XAU/USD.

Gold News

Bitcoin faces resistance around the $65,000 mark

Bitcoin faces resistance around the $65,000 mark

Bitcoin and Ethereum prices encountered rejections upon reaching resistance levels near $65,000 and $3,530, respectively. Meanwhile, Ripple price might undergo a pullback towards the 61.8% Fibonacci retracement level at $0.480.

Read more

Stock selloff begins to broaden out

Stock selloff begins to broaden out

The ECB provided little cheer for European investors this afternoon, and the sell-off in tech stocks appears to have further to go. The pockets of strength in the Dow and small caps are being eroded as the risk-off move gathers pace once again.

Read more

Forex MAJORS

Cryptocurrencies

Signatures