|

Crude Oil WTI Technical Analysis: Too far too fast can send oil back to $67.00 a barrel

  • Crude oil bulls showed on Friday that the main bull trend is still alive despite the deep pullback since early July.
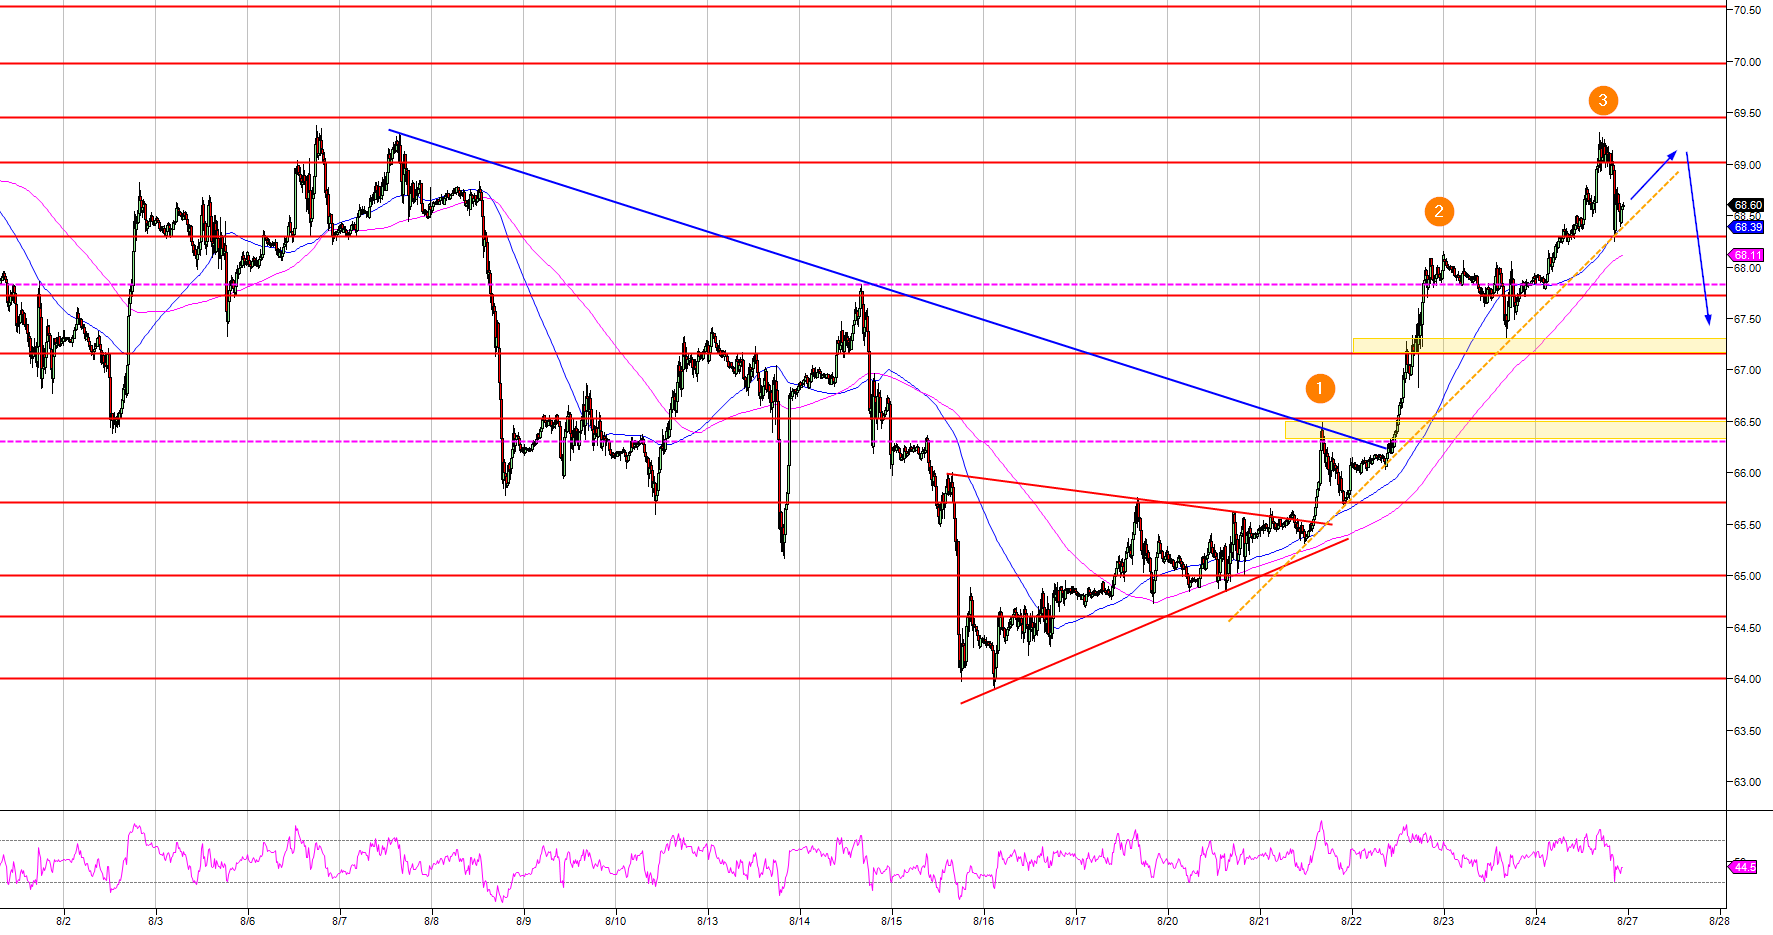
  • Oil has made three pushes up (after the red triangle) and the market might be ripe for a pullback down as WTI is finding some resistance at the 69.00 figure and the 50 and 100-period simple moving averages on the daily chart. 
  • If oil breaks below 68.30, targets to the downside are located at 67.16 and 66.53 swing points. A bull failure on a retest of 69.00 figure can be a short opportunity as well for a near-term revesral down.

Crude oil WTI 15-minute chart

Spot rate:             69.60
Relative change:  1.12%     
High:                     69.28
Low:                      67.76

Main Trend:          Bullish  
Short-term trend:  Bearish below 68.30 or a failure above 69.00

Resistance 1:       69.00 figure
Resistance 2:       69.44 June 25 high
Resistance 3:       70.00 figure

Support 1:            68.30 supply/demand level
Support 2:            67.84 August 14 swing high
Support 3:            67.16-67.72 June 14 high-June 26 low 
Support 4:            66.30-66.53 area, July 18 swing low and June 20 high
Support 5:            65.71, June 22 low
Support 6:            64.60 May 28 low
Support 7:            64.00 figure
Support 8:            63.63 June 11 low
Support 9:            62.40 June 18 low 

Author

Flavio Tosti

Flavio Tosti

Independent Analyst


More from Flavio Tosti
Share:

Editor's Picks

EUR/USD: Breakdown below trading range support near 1.1770 comes into play

The EUR/USD pair opens with a bearish gap at the start of a new week as the US-Iran war-led global flight to safety boosts the US Dollar. Spot prices, however, lack follow-through selling and manage to hold above mid-1.1700s during the Asian session.

GBP/USD targets 1.3500 barrier near moving averages

GBP/USD rebounds from the daily losses, trading around 1.3450 during the Asian hours on Monday. The technical analysis of the daily chart indicates an ongoing bearish bias, as the pair trades within a descending channel pattern.

Gold retreats from $5,400; still up over 1% amid Middle East tensions

Gold retreats from the $5,400 neighborhood, or its highest level since late January, touched in the Asian session on Monday, though it manages to hold above the $5,300 round figure. The bright metal opened with a bullish gap of about $17 and rallied toward the $5,400 level as Asian traders hit their desks and reacted negatively to the weekend news of the US and Israel attacks on Iran, rushing for cover in Gold.

Top Crypto Losers: Tezos, Toncoin, and Polkadot at crucial levels amid US-Israel strike on Iran

Altcoins such as Tezos, Toncoin, and Polkadot rank among the worst hit cryptocurrencies over the last 24 hours amid the US and Israel's attack on Iran. Tezos and Toncoin are down to crucial support levels while Polkadot remains near a crucial resistance trendline, showcasing underlying strength.

The market is paying for insurance, not apocalypse

As expected, this morning felt less like a Monday market open and more like a fire drill. Futures screens flickered red. S&P contracts down almost 1%. Nasdaq off 1.2%. Brent leaped 13% through $80. Gold rose 1.6% toward $5350 before paring some gains. The dollar is strutting mildly. The Swiss franc is quietly doing what it always does in a storm, catching some safe-haven flows.

Starknet unveils strkBTC, shielded Bitcoin transactions on Ethereum Layer 2

Starknet, the Ethereum Layer 2 network developed by StarkWare, today announced strkBTC, a wrapped Bitcoin asset that introduces optional shielding while preserving full DeFi composability.