- WTI declined on Thursday, extending losses as broad-market risk flows reverse direction.
- Crude Oil markets are facing declines, shrugging off an unexpected decline in US crude stocks.
- Rough year-end markets are pulling down barrel prices to close out 2023.
West Texas Intermediate (WTI) US Crude Oil extended a decline on Thursday, backsliding into the low end and testing below the $72 handle as market risk appetite sours following a surprise jump in US Treasury yields, and shrugging off a surprise decline in US crude stocks.
According to figures from the Energy Information Administration (EIA), US barrel counts declined an unexpected -6.9 million barrels for the week ended December 22, far below the forecast 2.7 million decline and eating away at the previous week’s 2.9 million barrel buildup.
Red Sea tensions have begun to recede as logistics return to the region. Tensions mounted after Iran-backed Houthi rebels in Yemen began attacking logistics ships passing through the Red Sea, but a coalition naval force has descended on the region to allow ships to resume passing through the critical supply line between Europe and Asia.
2023’s production clampdown by the Organization of the Petroleum Exporting Countries (OPEC) failed to spark a long-term bull run in Crude Oil bids, as several smaller member states snub the oil cartel’s voluntary production caps, sparking the departure of Angola from the oil organization’s ranks. Despite key member states dedicated to ongoing production cuts, most notably Saudi Arabia extending over a million barrels per day in pumping reductions, Crude Oil production continues to outpace global oil demand.
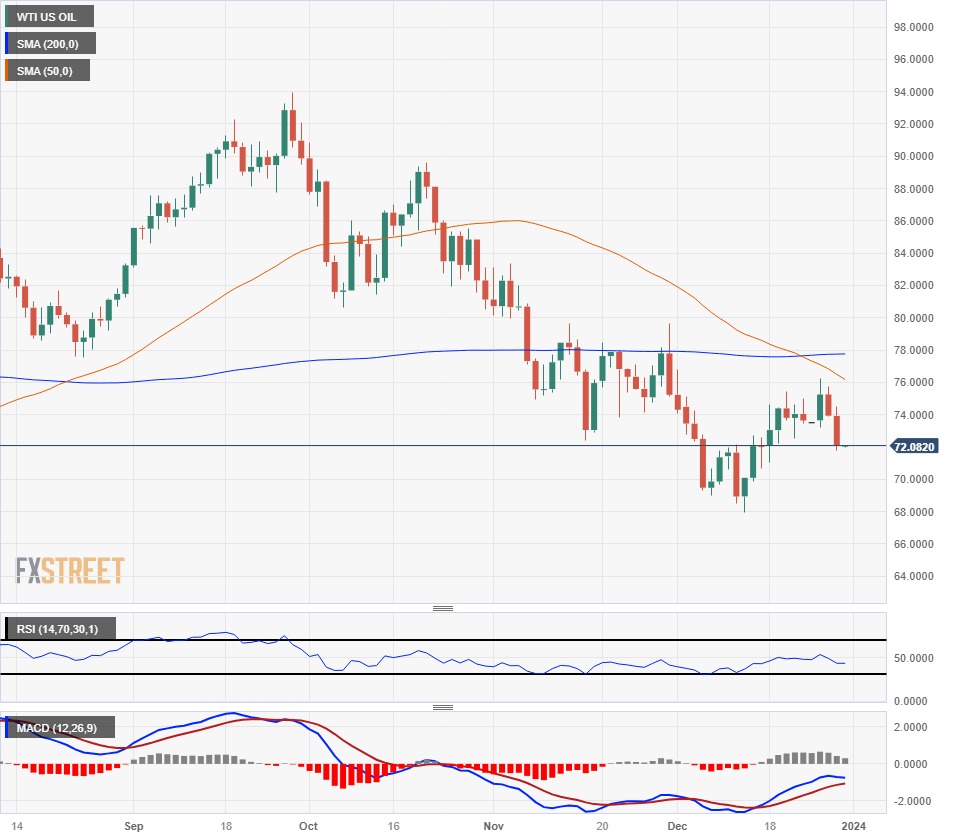
WTI Technical Levels
Intraday US Crude Oil action has dragged WTI down through the 200-day Simple Moving Average (SMA) near $73.75, descending to re-test chart territory below the $72 handle.
WTI has declined nearly 6% from the week’s high near $76.20, marking in a lower high on the daily candlesticks and pricing in a new technical ceiling while the 50-day SMA accelerates into the low side of the 200-day SMA after confirming a bearish cross.
WTI Daily Chart
WTI Technical Levels
Information on these pages contains forward-looking statements that involve risks and uncertainties. Markets and instruments profiled on this page are for informational purposes only and should not in any way come across as a recommendation to buy or sell in these assets. You should do your own thorough research before making any investment decisions. FXStreet does not in any way guarantee that this information is free from mistakes, errors, or material misstatements. It also does not guarantee that this information is of a timely nature. Investing in Open Markets involves a great deal of risk, including the loss of all or a portion of your investment, as well as emotional distress. All risks, losses and costs associated with investing, including total loss of principal, are your responsibility. The views and opinions expressed in this article are those of the authors and do not necessarily reflect the official policy or position of FXStreet nor its advertisers. The author will not be held responsible for information that is found at the end of links posted on this page.
If not otherwise explicitly mentioned in the body of the article, at the time of writing, the author has no position in any stock mentioned in this article and no business relationship with any company mentioned. The author has not received compensation for writing this article, other than from FXStreet.
FXStreet and the author do not provide personalized recommendations. The author makes no representations as to the accuracy, completeness, or suitability of this information. FXStreet and the author will not be liable for any errors, omissions or any losses, injuries or damages arising from this information and its display or use. Errors and omissions excepted.
The author and FXStreet are not registered investment advisors and nothing in this article is intended to be investment advice.
Recommended content
Editors’ Picks

Gold trades near record-high, stays within a touching distance of $3,100
Gold clings to daily gains and trades near the record-high it set above $3,080 earlier in the day. Although the data from the US showed that core PCE inflation rose at a stronger pace than expected in February, it failed to boost the USD.

EUR/USD turns positive above 1.0800
The loss of momentum in the US Dollar allows some recovery in the risk-associated universe on Friday, encouraging EUR/USD to regain the 1.0800 barrier and beyond, or daily tops.

GBP/USD picks up pace and retests 1.2960
GBP/USD now capitalises on the Greenback's knee-jerk and advances to the area of daily peaks in the 1.2960-1.2970 band, helped at the same time by auspicious results from UK Retail Sales.

Donald Trump’s tariff policies set to increase market uncertainty and risk-off sentiment
US President Donald Trump’s tariff policies are expected to escalate market uncertainty and risk-off sentiment, with the Kobeissi Letter’s post on X this week cautioning that while markets may view the April 2 tariffs as the "end of uncertainty," it anticipates increased volatility.

US: Trump's 'Liberation day' – What to expect?
Trump has so far enacted tariff changes that have lifted the trade-weighted average tariff rate on all US imports by around 5.5-6.0%-points. While re-rerouting of trade will decrease the effectiveness of tariffs over time, the current level is already close to the highest since the second world war.

The Best brokers to trade EUR/USD
SPONSORED Discover the top brokers for trading EUR/USD in 2025. Our list features brokers with competitive spreads, fast execution, and powerful platforms. Whether you're a beginner or an expert, find the right partner to navigate the dynamic Forex market.