- WTI's Friday bounce still sees Crude Oil down for a seventh straight week.
- US Crude Oil fell to a near-term floor of $69.01 on Thursday.
- OPEC's pumping caps are seeing little impact as Chinese demand slumps.
Crude Oil markets are seeing a moderate recovery on Friday with West Texas Intermediate (WTI) climbing two percent on the day, but pressured oil markets are still set for a seventh straight week of declines.
The Organization of the Petroleum Exporting Countries (OPEC) scrambled to solidify a group-wide agreement on production cuts after member states came to loggerheads over pumping quotas. Key OPEC members, headed up by Saudi Arabia, have aggressively pursued tighter production caps in order to keep Crude Oil prices bid. However, flagging fuel demand, specifically from China, and disobedient OPEC member states decrying production caps are throwing a wrench in OPEC’s efforts to intentionally undersupply global Crude Oil Markets.
OPEC’s current production caps see the oil cartel agreeing to a combined 2.2 million bpd cut to total Crude Oil production through the first quarter of 2024, but fossil markets remain skeptical about OPEC’s ability to enforce the loose agreement.
OPEC currently has no mechanism of enforcing Crude Oil production quotas, and there is currently no punishment for member countries that choose to flaunt pumping limits and sell more oil than OPEC agreements allow.
Adding fuel to the fire, Chinese imports of Crude Oil declined by 9% in November compared to last year as Chinese demand for fossil fuels sumps alongside China’s growth metrics.
Despite OPEC’s production-limiting efforts, Crude Oil supplies remain well-stocked with barrel inventories at healthy levels, sending the price of Crude down into multi-month lows.
WTI Technical Outlook
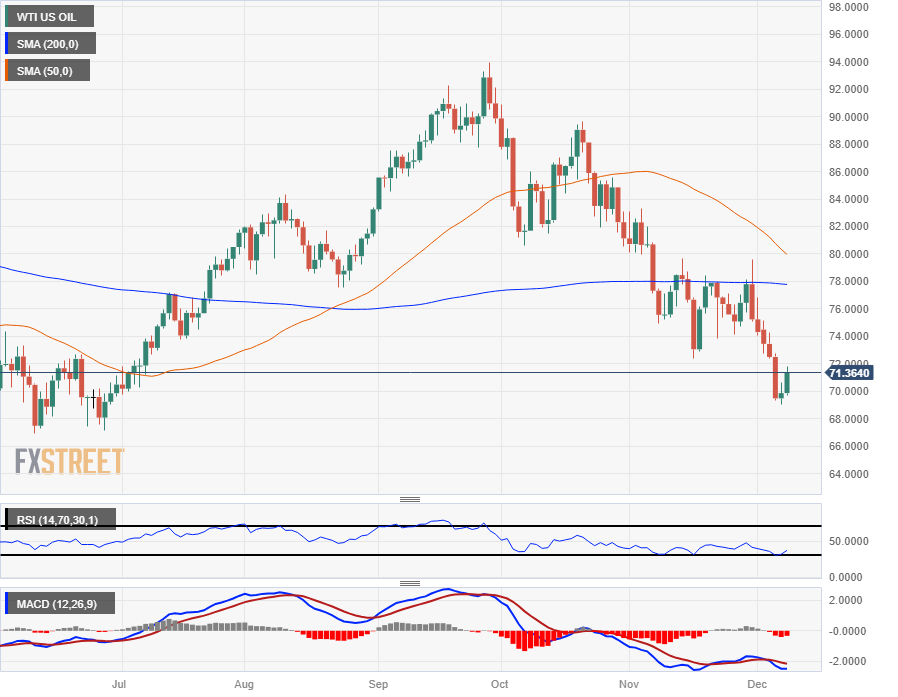
Despite Friday’s rebound after finding a floor on Thursday at $69.01, Crude Oil remains firmly under-bid after closing in the red for five consecutive days into Tuesday, and WTI is on pace to end in the red for a seventh straight week.
WTI Crude Oil daily candlesticks remain firmly capped by the 200-day Simple Moving Average (SMA) near $78.00, with the 50-day SMA accelerating into the downside at $80.00.
Seven straight weeks of declines have dragged WTI down nearly twenty percent plus a half from the last peak of $89.64, and US Crude Oil is down nearly twenty-seven percent from September’s peak just below $94.00 per barrel.
WTI Daily Chart
WTI Technical Levels
Information on these pages contains forward-looking statements that involve risks and uncertainties. Markets and instruments profiled on this page are for informational purposes only and should not in any way come across as a recommendation to buy or sell in these assets. You should do your own thorough research before making any investment decisions. FXStreet does not in any way guarantee that this information is free from mistakes, errors, or material misstatements. It also does not guarantee that this information is of a timely nature. Investing in Open Markets involves a great deal of risk, including the loss of all or a portion of your investment, as well as emotional distress. All risks, losses and costs associated with investing, including total loss of principal, are your responsibility. The views and opinions expressed in this article are those of the authors and do not necessarily reflect the official policy or position of FXStreet nor its advertisers. The author will not be held responsible for information that is found at the end of links posted on this page.
If not otherwise explicitly mentioned in the body of the article, at the time of writing, the author has no position in any stock mentioned in this article and no business relationship with any company mentioned. The author has not received compensation for writing this article, other than from FXStreet.
FXStreet and the author do not provide personalized recommendations. The author makes no representations as to the accuracy, completeness, or suitability of this information. FXStreet and the author will not be liable for any errors, omissions or any losses, injuries or damages arising from this information and its display or use. Errors and omissions excepted.
The author and FXStreet are not registered investment advisors and nothing in this article is intended to be investment advice.
Recommended content
Editors’ Picks

AUD/USD continues soft as markets digest employment data
The AUD/USD declined by 0.34% to 0.6470 in Thursday's session, extending its decline to a fresh three-month low of 0.6460. The US Dollar is easing after mixed data, while weak Australian employment data has reduced inflationary concerns, which might change the outlook of the Reserve Bank of Australia.

EUR/USD: Further declines remain well in store
EUR/USD briefly tested fresh year-long lows on Thursday, piercing the 1.0500 handle for the first time in 54 weeks. A lack of meaningful EU data is doing very little to provide support for the Euro, and Fiber bids continue to tilt in favor of the safe haven US Dollar.

Gold falls as Powell signals Fed's patience on lowering rates
Gold recovers some ground on Thursday yet remains trading below its opening price for the fifth consecutive day, undermined by the Greenback’s advance for its own fifth consecutive day. A slightly hot inflation report in the US and solid jobs data sponsored XAU/USD’s leg down toward the 100-day SMA.

Ethereum Price Forecast: ETH could rally to $4,522 despite mixed on-chain flows among investors
Ethereum is down over 1% on Thursday following record net inflows across ETH exchange-traded funds in the past six days. Despite the bullish market outlook, $300 million worth of unstaked ETH could hit the market and cause downward pressure on prices.

Trump vs CPI
US CPI for October was exactly in line with expectations. The headline rate of CPI rose to 2.6% YoY from 2.4% YoY in September. The core rate remained steady at 3.3%. The detail of the report shows that the shelter index rose by 0.4% on the month, which accounted for 50% of the increase in all items on a monthly basis.

Best Forex Brokers with Low Spreads
VERIFIED Low spreads are crucial for reducing trading costs. Explore top Forex brokers offering competitive spreads and high leverage. Compare options for EUR/USD, GBP/USD, USD/JPY, and Gold.