Crude Oil falls flat with weekly EIA numbers as gamechanger
- Crude Oil faces selling pressure, pushing Crude Oil prices back to $70.00.
- Traders piled into safe havens such as the US Dollar, while bonds and equities are diving lower.
- The US Dollar Index looks set for more upside after breaking above 103.80 and tested 104.00.

Crude Oil is erasing its efforts from its earlier two-day rally on Wednesday after the American Petroleum Institute (API) reported a larger-than-expected increase in US stockpiles. In the Middle East, Secretary of State Antony Blinken urged Israel to avoid further escalating the conflict within Iran. Blinken said in Tel Aviv that there is an opportunity for a hostage agreement, according to Bloomberg. This takes the sting out a bit from the recent developments between Israel and Iran.
The US Dollar Index (DXY), which tracks the performance of the Greenback against six other currencies, is picking up a nudge and has broken above 104.00. Markets are starting to position for the most eventful week of this financial year with the US presidential election on November 5 and the Federal Reserve’s (Fed) interest-rate decision on November 7. The King Dollar seems to be returning to the scene while traders and investors trim their exposure on bonds and equities, fleeing to the Greenback.
At the time of writing, Crude Oil (WTI) trades at $71.35 and Brent Crude at $75.30
Oil news and market movers: Blinken lands in Middle East
- The American Petroleum Institute (API) has reported overnight that the US stockpile change number came in at a build of 1.643 million barrels, more than the expected 0.7 million and the previous draw last week of 1.58 million barrels.
- The Energy Information Administration (EIA) will report its numbers at 14:30 GMT. The expectation is for a small build of 0.7 million barrels after the chunky drawdown of 2.191 million barrels a week earlier.
- Secretary of State Antony Blinken held extensive conversations with Israeli Prime Minister Benjamin Netanyahu and senior Israeli leaders. Blinken urged Israel to get more humanitarian aid into Gaza, a senior State Department official confirmed to Reuters.
Oil Technical Analysis: Make or break for Oil this week
Crude Oil price might have had a brief rally, popping back above $70.00. However, the underlying fundamental driver is the oversupply of barrels of Oil per day that is being unleashed to markets. In case the stockpile numbers from the EIA point to a bigger-than-expected build, expect to see how the consolidation in Oil prices fades and Oil pulls back to $70.00 or lower.
There is a challenging path to recovery for Crude Oil in the coming days. First, the pivotal level at $71.46, which was strong enough to catch the falling knife on October 14, must be regained again with a daily close above it. Once from there, the hefty technical level at $75.13, with the 100-day Simple Moving Average (SMA) and a few pivotal lines, is possibly the first big hurdle ahead.
On the downside, traders need to look much lower, at $67.12, a level that supported the price in May andJune 2023. In case that level breaks, the 2024 year-to-date low emerges at $64.75 followed by $64.38, the low from 2023.
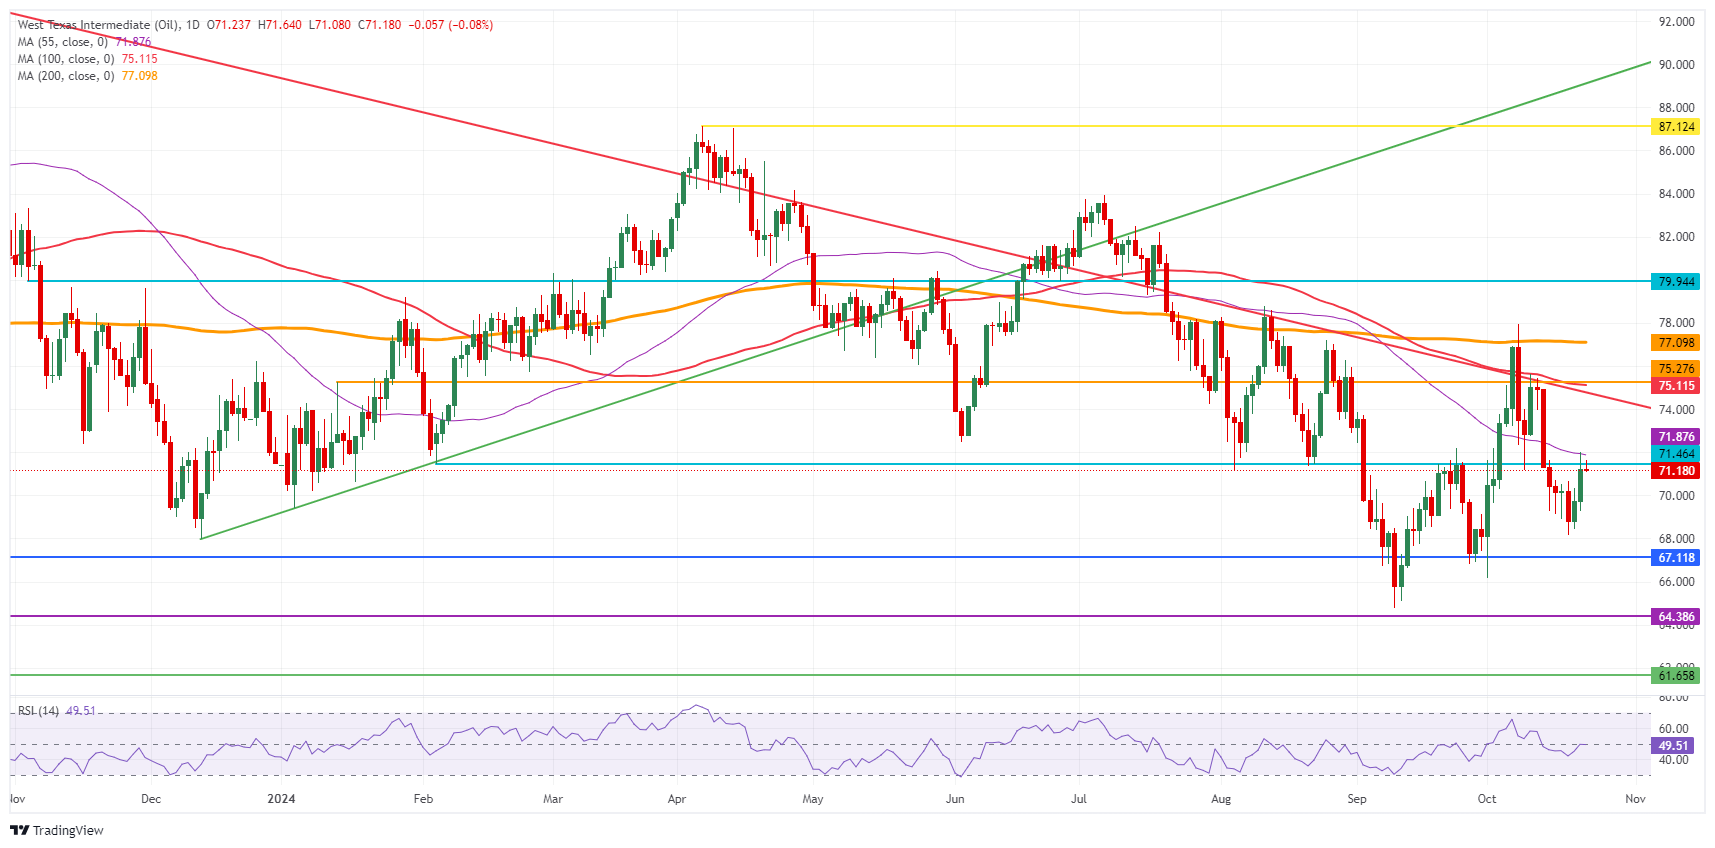
US WTI Crude Oil: Daily Chart
WTI Oil FAQs
WTI Oil is a type of Crude Oil sold on international markets. The WTI stands for West Texas Intermediate, one of three major types including Brent and Dubai Crude. WTI is also referred to as “light” and “sweet” because of its relatively low gravity and sulfur content respectively. It is considered a high quality Oil that is easily refined. It is sourced in the United States and distributed via the Cushing hub, which is considered “The Pipeline Crossroads of the World”. It is a benchmark for the Oil market and WTI price is frequently quoted in the media.
Like all assets, supply and demand are the key drivers of WTI Oil price. As such, global growth can be a driver of increased demand and vice versa for weak global growth. Political instability, wars, and sanctions can disrupt supply and impact prices. The decisions of OPEC, a group of major Oil-producing countries, is another key driver of price. The value of the US Dollar influences the price of WTI Crude Oil, since Oil is predominantly traded in US Dollars, thus a weaker US Dollar can make Oil more affordable and vice versa.
The weekly Oil inventory reports published by the American Petroleum Institute (API) and the Energy Information Agency (EIA) impact the price of WTI Oil. Changes in inventories reflect fluctuating supply and demand. If the data shows a drop in inventories it can indicate increased demand, pushing up Oil price. Higher inventories can reflect increased supply, pushing down prices. API’s report is published every Tuesday and EIA’s the day after. Their results are usually similar, falling within 1% of each other 75% of the time. The EIA data is considered more reliable, since it is a government agency.
OPEC (Organization of the Petroleum Exporting Countries) is a group of 12 Oil-producing nations who collectively decide production quotas for member countries at twice-yearly meetings. Their decisions often impact WTI Oil prices. When OPEC decides to lower quotas, it can tighten supply, pushing up Oil prices. When OPEC increases production, it has the opposite effect. OPEC+ refers to an expanded group that includes ten extra non-OPEC members, the most notable of which is Russia.
Author

Filip Lagaart
FXStreet
Filip Lagaart is a former sales/trader with over 15 years of financial markets expertise under its belt.


