- Crude Oil markets rebound after EIA reports a significant drawdown in US stocks.
- WTI still remains below the early week’s peaks.
- Geopolitical concerns continue to add a risk premium to energies.
West Texas Intermediate (WTI) US Crude Oil bounced into the high end on Wednesday, climbing back towards $83.50 per barrel after an early dip back to $82.00. The Energy Information Administration (EIA) posted a much larger week-on-week drawdown in US Crude Oil reserves, sparking a risk rally despite an initial plunge following worse-than-expected economic figures from the US.
According to the EIA, US Crude Oil Stocks Change for the week ended June 28 contracted sharply by -12.157 million barrels, well below the forecast drawdown of -150K and entirely engulfing the previous week’s 3.591 million barrel buildup. The EIA also noted similar, albeit smaller, drawdowns in gasoline and distillate inventories over the same period.
Crude Oil markets initially balked on Wednesday before an EIA-fueled rally, with WTI backsliding to $81.00 per barrel after the US reported a broad miss in key economic figures. ADP Employment Change eased to 150K from the previous 157K, Initial Jobless Claims ticked up to 238K for the week ended June 28 from 233K, and June’s USM Services Purchasing Managers Index (PMI) tumbled to a multi-year low of 48.8 compared to the previous month’s 53.8.
The ongoing Israel-Palestinian Hamas conflict continues to broil in the Middle East, keeping a firm risk bid underpinning Crude Oil prices as energy traders hold onto fears that a destabilization of the situation would see the conflict spill over into neighboring countries, specifically drawing Iran directly into matters.
Economic Indicator
EIA Crude Oil Stocks Change
The EIA Crude Oil stockpiles report is a weekly measure of the change in the number of barrels in stock of crude oil and its derivates, and it's released by the Energy Information Administration. This report tends to generate large price volatility, as oil prices impact on worldwide economies, affecting the most, commodity related currencies such as the Canadian dollar. Despite it has a limited impact among currencies, this report tends to affect the price of oil itself, and, therefore, had a more notorious impact on WTI crude futures.
Read more.Last release: Wed Jul 03, 2024 14:30
Frequency: Weekly
Actual: -12.157M
Consensus: -0.15M
Previous: 3.591M
WTI technical outlook
Despite a bullish push on Wednesday, WTI trades south of the early week’s peak bids near $83.75 and found a fresh technical floor at the $82.00 handle. However, intraday price action is still holding just north of the 200-hour Exponential Moving Average (EMA) at $81.55.
After a bullish breakout from a rough near-term consolidation phase, WTI is leaning steeper into a bull run, but momentum remains thin and could see Crude Oil backslide into the 200-day EMA rising above the $74.00 handle.
WTI hourly chart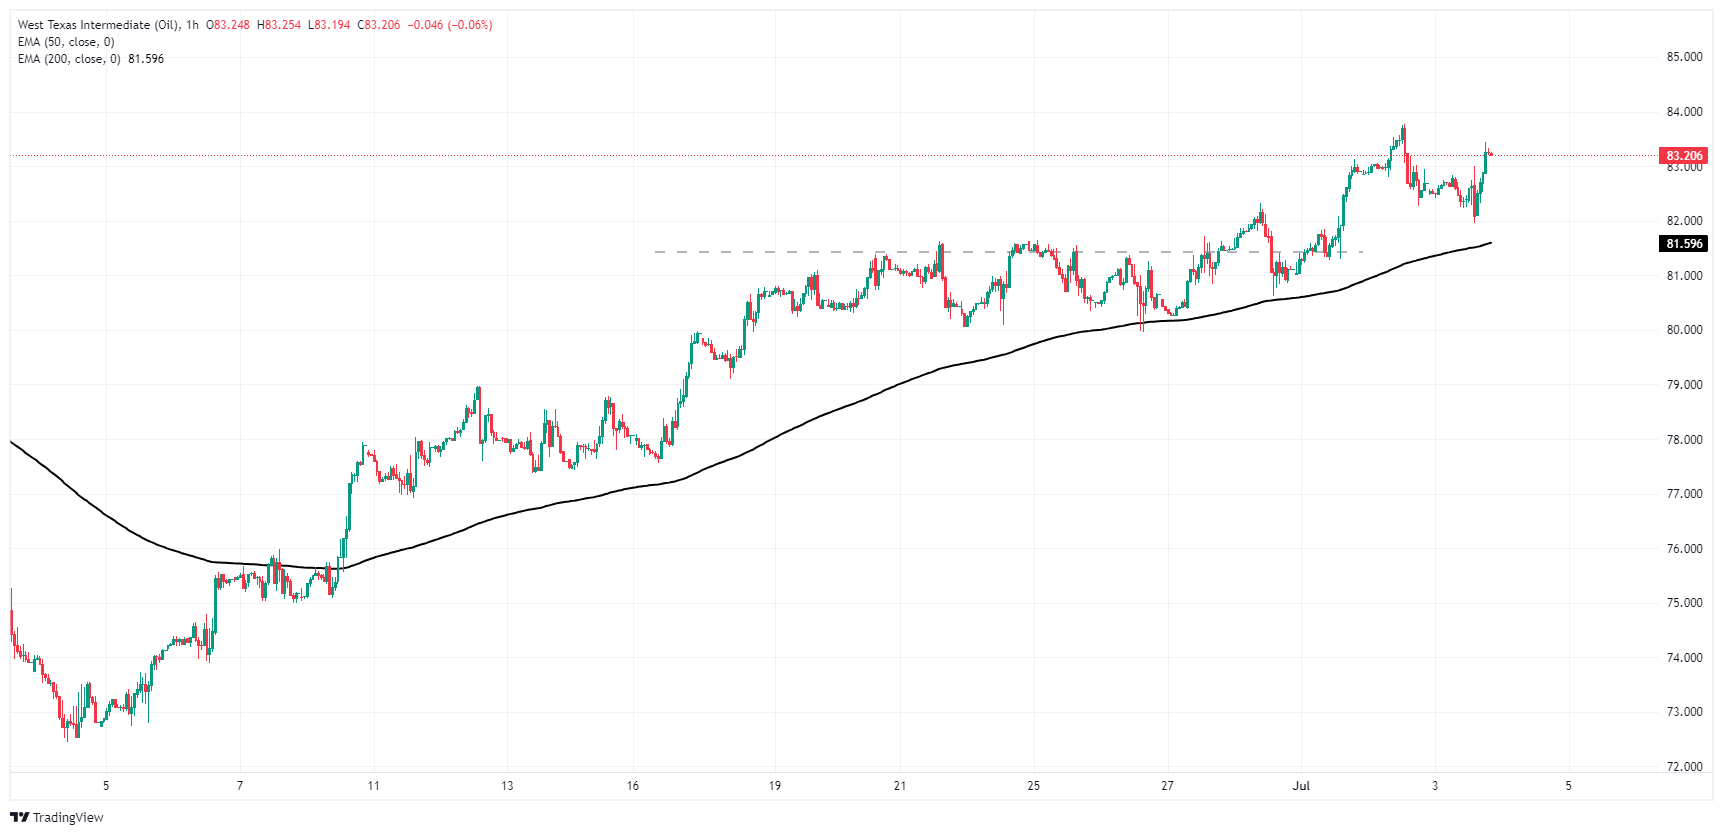
WTI daily chart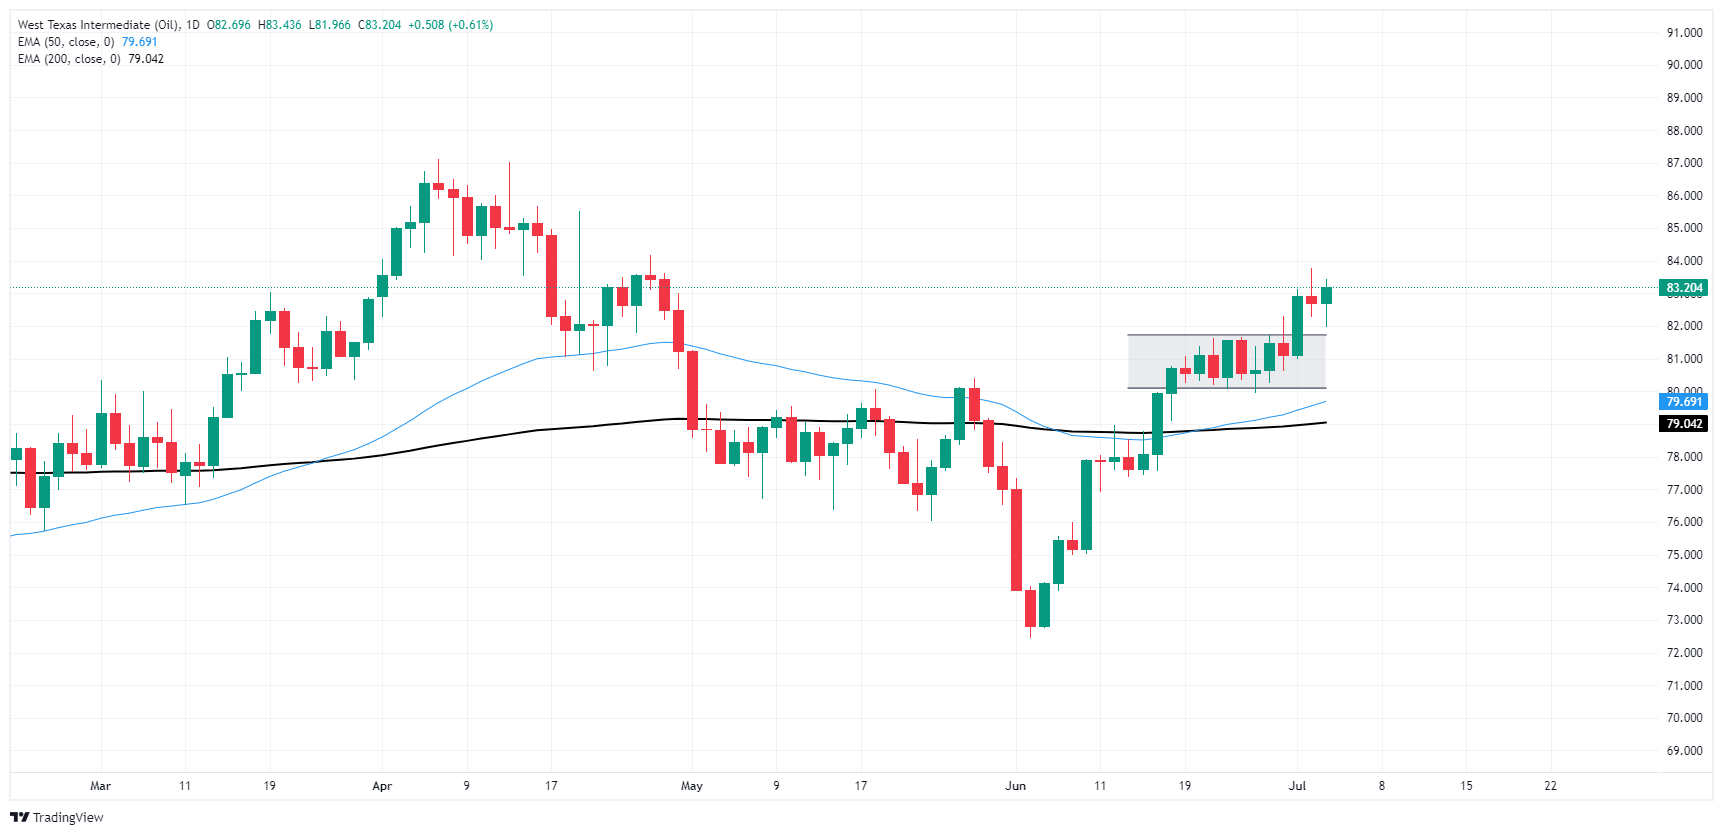
WTI Oil FAQs
WTI Oil is a type of Crude Oil sold on international markets. The WTI stands for West Texas Intermediate, one of three major types including Brent and Dubai Crude. WTI is also referred to as “light” and “sweet” because of its relatively low gravity and sulfur content respectively. It is considered a high quality Oil that is easily refined. It is sourced in the United States and distributed via the Cushing hub, which is considered “The Pipeline Crossroads of the World”. It is a benchmark for the Oil market and WTI price is frequently quoted in the media.
Like all assets, supply and demand are the key drivers of WTI Oil price. As such, global growth can be a driver of increased demand and vice versa for weak global growth. Political instability, wars, and sanctions can disrupt supply and impact prices. The decisions of OPEC, a group of major Oil-producing countries, is another key driver of price. The value of the US Dollar influences the price of WTI Crude Oil, since Oil is predominantly traded in US Dollars, thus a weaker US Dollar can make Oil more affordable and vice versa.
The weekly Oil inventory reports published by the American Petroleum Institute (API) and the Energy Information Agency (EIA) impact the price of WTI Oil. Changes in inventories reflect fluctuating supply and demand. If the data shows a drop in inventories it can indicate increased demand, pushing up Oil price. Higher inventories can reflect increased supply, pushing down prices. API’s report is published every Tuesday and EIA’s the day after. Their results are usually similar, falling within 1% of each other 75% of the time. The EIA data is considered more reliable, since it is a government agency.
OPEC (Organization of the Petroleum Exporting Countries) is a group of 13 Oil-producing nations who collectively decide production quotas for member countries at twice-yearly meetings. Their decisions often impact WTI Oil prices. When OPEC decides to lower quotas, it can tighten supply, pushing up Oil prices. When OPEC increases production, it has the opposite effect. OPEC+ refers to an expanded group that includes ten extra non-OPEC members, the most notable of which is Russia.
Information on these pages contains forward-looking statements that involve risks and uncertainties. Markets and instruments profiled on this page are for informational purposes only and should not in any way come across as a recommendation to buy or sell in these assets. You should do your own thorough research before making any investment decisions. FXStreet does not in any way guarantee that this information is free from mistakes, errors, or material misstatements. It also does not guarantee that this information is of a timely nature. Investing in Open Markets involves a great deal of risk, including the loss of all or a portion of your investment, as well as emotional distress. All risks, losses and costs associated with investing, including total loss of principal, are your responsibility. The views and opinions expressed in this article are those of the authors and do not necessarily reflect the official policy or position of FXStreet nor its advertisers. The author will not be held responsible for information that is found at the end of links posted on this page.
If not otherwise explicitly mentioned in the body of the article, at the time of writing, the author has no position in any stock mentioned in this article and no business relationship with any company mentioned. The author has not received compensation for writing this article, other than from FXStreet.
FXStreet and the author do not provide personalized recommendations. The author makes no representations as to the accuracy, completeness, or suitability of this information. FXStreet and the author will not be liable for any errors, omissions or any losses, injuries or damages arising from this information and its display or use. Errors and omissions excepted.
The author and FXStreet are not registered investment advisors and nothing in this article is intended to be investment advice.
Recommended content
Editors’ Picks

EUR/USD remains pressured below 1.0800 on renewed USD strength
EUR/USD stays under pressure and declines toward 1.0750 following Thursday's recovery. A renewed US Dollar uptick and a cautious mood weigh on the pair, as traders digest the Trump win and the Federal Reserve's monetary policy announcements.

GBP/USD holds lower ground near 1.2950 amid tepid risk sentiment
GBP/USD trades in negative territory at around 1.2950 in the second half of the day on Friday. The emergence of dip-buying in the US Dollar and a tepid risk tone undermine the pair. The BoE’s cautious rate cut could check the pair's downside as traders comments from central bankers.

Gold fluctuates below $2,700 amid stronger USD, positive risk tone
Gold trades below $2,700 in the early American session on Friday and is pressured by a combination of factors. Hopes that Trump's policies would spur economic growth and inflation, to a larger extent, overshadow the Fed's dovish outlook, which, in turn, helps revive the USD demand.

Week ahead – US CPI to shift market focus back to data after Trump shock
After Trump comeback, normality to return to markets with US CPI. GDP data from UK and Japan to also be important. But volatility to likely persist as markets assess impact of Trump.
October’s US CPI rates to be the next big test for the greenback
With the US elections being over, Trump getting elected and the Fed having released its interest rate decision, we take a look at what next week has in store for the markets. On the monetary front a number of policymakers from various central banks are scheduled to speak at some point or the other.

Best Forex Brokers with Low Spreads
VERIFIED Low spreads are crucial for reducing trading costs. Explore top Forex brokers offering competitive spreads and high leverage. Compare options for EUR/USD, GBP/USD, USD/JPY, and Gold.