- Chinese economic slowdown exacerbates the case of slowing oil demand.
- Market players keep an eye on nuclear discussions between the US and Iran.
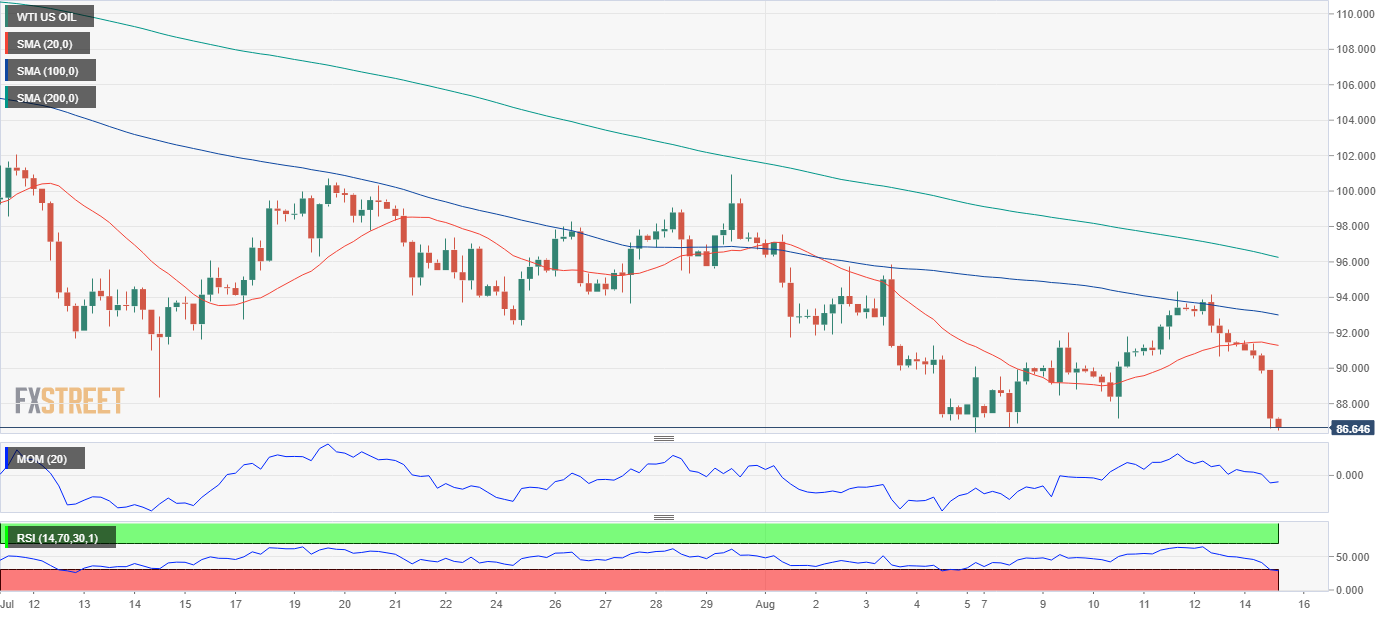
- WTI trades near the August low at $86.99 and with a firmly bearish technical stance.
Crude oil prices are in free fall at the beginning of the week, with the barrel of West Texas Intermediate currently trading at $86.63, not far from this month's low at $86.40.
Several factors are weighing on oil prices, the main one being the worsening demand outlook. The data from China showed that the country's crude throughput fell to its lowest level since March 2020 at 53.21 million tonnes of crude oil in July. That number was also 8.8% lower than the same time last year. Additionally, disappointing Retail Sales and Industrial Production data from China revived concerns over a global recession.
On the supply side, Saudi Aramco's CEO said on Sunday that they would be able to raise the output to the max capacity of 12 million bpd if requested by the government. Looking ahead, Iran's response to the EU's offer to revive the 2015 nuclear deal, which is expected to be announced later in the day, could impact crude oil prices. In case Iran and the US reach an agreement, that could lead to the removal of sanctions on Iran's oil and gas exports.
WTI technical outlook
The aforementioned August low is the lowest WTI traded since February, which means that a break below it could result in a steeper decline. The initial bearish target and immediate support level is the $86.10 area, where the black gold has several intraday highs and lows from January this year. A bearish breakout could result in a test of the $85.00 figure. The sour tone of equities will likely keep crude oil prices on the downside through the rest of the day.
Should Wall Street recover, WTI may also find some demand. Intraday resistance stands at $88.50 and $90.00. Nevertheless, technical readings support a near-term downward extension, adding to the negative fundamental picture.

Information on these pages contains forward-looking statements that involve risks and uncertainties. Markets and instruments profiled on this page are for informational purposes only and should not in any way come across as a recommendation to buy or sell in these assets. You should do your own thorough research before making any investment decisions. FXStreet does not in any way guarantee that this information is free from mistakes, errors, or material misstatements. It also does not guarantee that this information is of a timely nature. Investing in Open Markets involves a great deal of risk, including the loss of all or a portion of your investment, as well as emotional distress. All risks, losses and costs associated with investing, including total loss of principal, are your responsibility. The views and opinions expressed in this article are those of the authors and do not necessarily reflect the official policy or position of FXStreet nor its advertisers. The author will not be held responsible for information that is found at the end of links posted on this page.
If not otherwise explicitly mentioned in the body of the article, at the time of writing, the author has no position in any stock mentioned in this article and no business relationship with any company mentioned. The author has not received compensation for writing this article, other than from FXStreet.
FXStreet and the author do not provide personalized recommendations. The author makes no representations as to the accuracy, completeness, or suitability of this information. FXStreet and the author will not be liable for any errors, omissions or any losses, injuries or damages arising from this information and its display or use. Errors and omissions excepted.
The author and FXStreet are not registered investment advisors and nothing in this article is intended to be investment advice.
Recommended content
Editors’ Picks

EUR/USD stabilizes near 1.0400 after upbeat US data
EUR/USD consolidates daily recovery gains near 1.0400 following the release of upbeat United States data. Q3 GDP was upwardly revised to 3.1% from 2.8% previously, while weekly unemployment claims improved to 220K in the week ending December 13.

GBP/USD extends slide approaches 1.2500 after BoE rate decision
GBP/USD stays on the back foot and break lower, nearing 1.2500 after the Bank of England (BoE) monetary policy decisions. The BoE maintained the bank rate at 4.75% as expected, but the accompanying statement leaned to dovish, while three out of nine MPC members opted for a cut.

Gold approaches recent lows around $2,580
Gold resumes its decline after the early advance and trades below $2,600 early in the American session. Stronger than anticipated US data and recent central banks' outcomes fuel demand for the US Dollar. XAU/USD nears its weekly low at $2,582.93.

Bitcoin slightly recovers after sharp sell-off following Fed rate cut decision
Bitcoin (BTC) recovers slightly, trading around $102,000 on Thursday after dropping 5.5% the previous day. Whales, corporations, and institutional investors saw an opportunity to take advantage of the recent dips and added more BTC to their holdings.

Bank of England stays on hold, but a dovish front is building
Bank of England rates were maintained at 4.75% today, in line with expectations. However, the 6-3 vote split sent a moderately dovish signal to markets, prompting some dovish repricing and a weaker pound. We remain more dovish than market pricing for 2025.

Best Forex Brokers with Low Spreads
VERIFIED Low spreads are crucial for reducing trading costs. Explore top Forex brokers offering competitive spreads and high leverage. Compare options for EUR/USD, GBP/USD, USD/JPY, and Gold.