Crude Oil falls back into familiar bottoms on Friday pullback, WTI cracks $77.00 once again
- WTI has returned to territory below $77.00 five times in eight days.
- Crude Oil markets are getting pushed back into the low side of rough congestion.
- Analysts expect OPEC to extend Q1 cuts through Q2.

West Texas Intermediate (WTI) dipped back below $77.00 on Friday as energies pull back from recent bullish momentum which failed to crack into meaning high territory. WTI is set to wrap up the trading week near $76.50, a region that US Crude Oil has been struggling to break from since rising into the zone on February 9.
According to a survey by Bloomberg, analysts that watch the Organization of the Petroleum Exporting Countries (OPEC) expect the Crude Oil cartel to extend steep production cuts from the first quarter through Q2 2024. OPEC introduced drastic Crude Oil production caps across its member states late 2023, but attempts to constrain global Crude Oil supply in order to support barrel prices continues to run into significant headwinds as energy markets have their hands full watching global non-OPEC production and keeping an eye out for ongoing geopolitical headlines.
Crude Oil markets remain concerned about possible supply shocks as the Israel-Palestinian Hamas conflict in Gaza rolls on, and Yemini Houthis backed by Iran continue to target civilian cargo ships in the Red Sea despite the presence of a coalition naval fleet between the US and the UK.
As it currently stands, OPEC has not announced their Q2 plans, nor have they set a date to begin discussing the group’s production levels heading into the tail end of the first quarter.
WTI technical outlook
WTI fell back below the 200-hour Simple Moving Average (SMA) at $77.47 for the third time in a week as bullish momentum continues to evaporate. US Crude Oil is building out a rough consolidation pattern in the near-term, with a technical resistance zone marked in just below $79.00.
Daily candlesticks are seeing stiff technical resistance from the 200-day SMA at $77.60, and a bullish recovery from the last major swing low into $67.97 in December has struggled to gain meaningful chart territory.
WTI hourly chart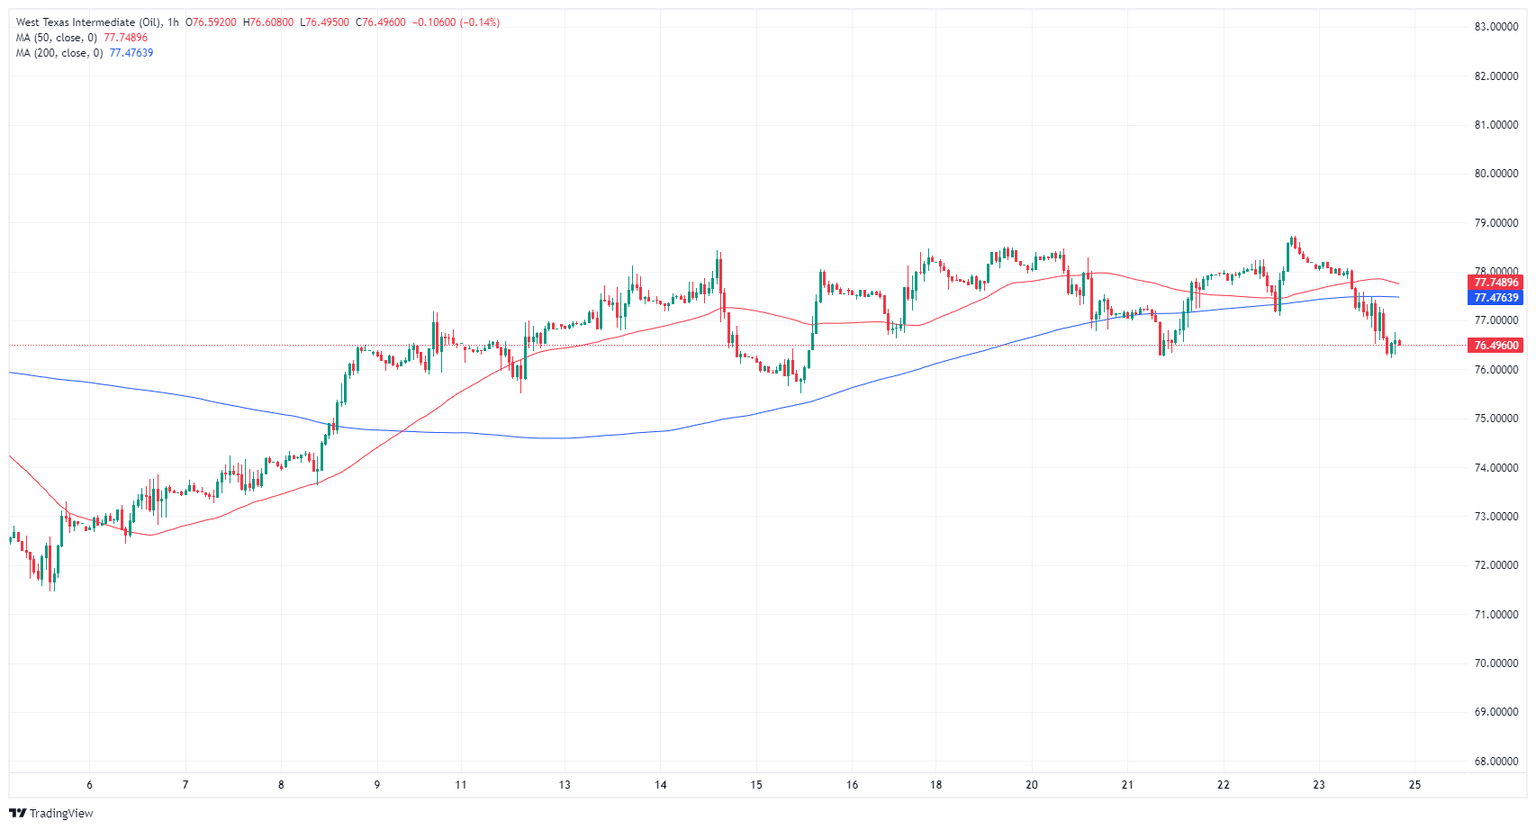
WTI daily chart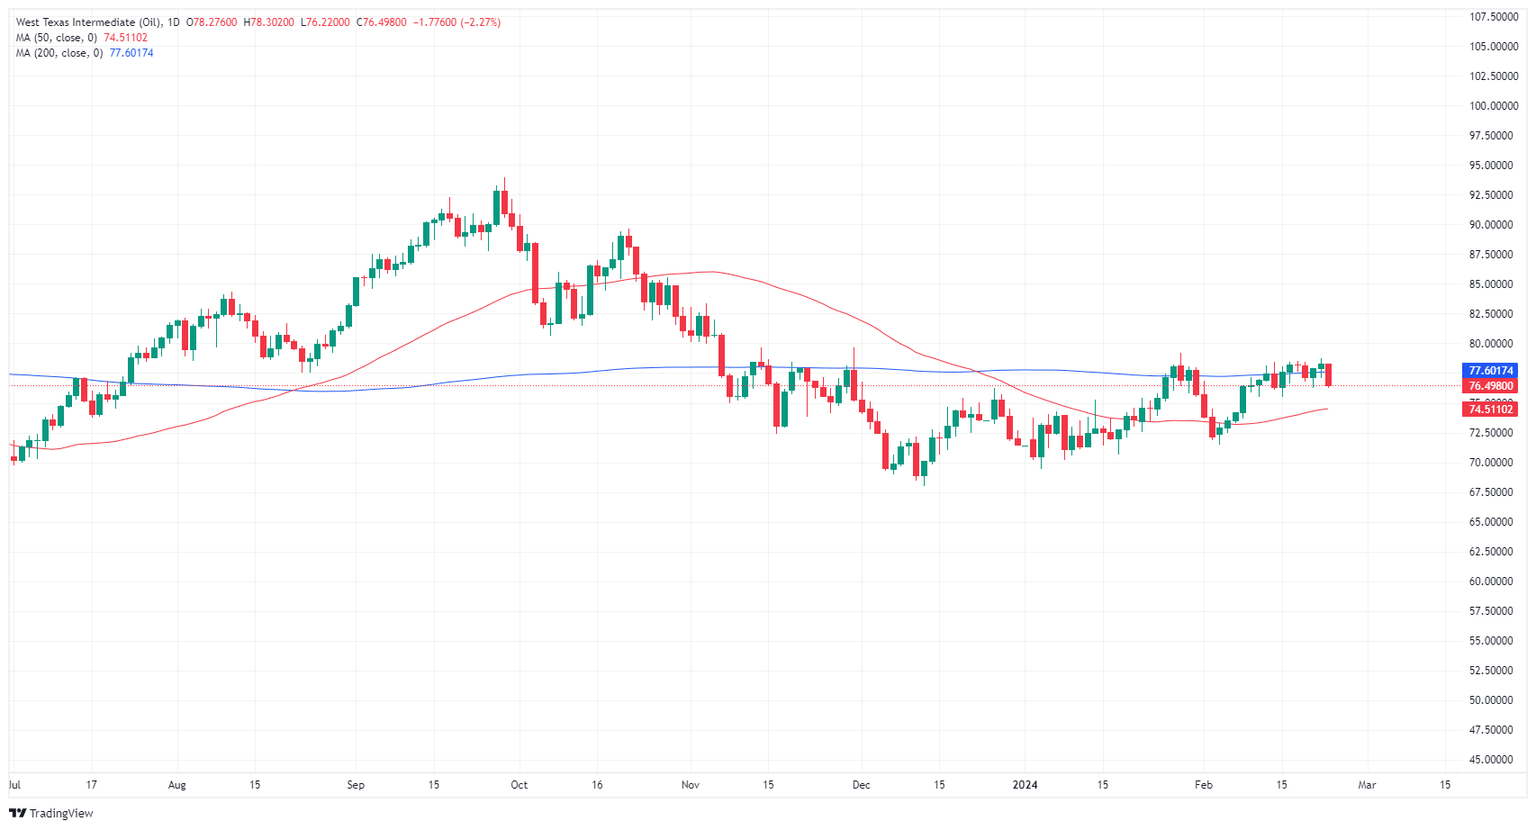
Author

Joshua Gibson
FXStreet
Joshua joins the FXStreet team as an Economics and Finance double major from Vancouver Island University with twelve years' experience as an independent trader focusing on technical analysis.