- Crude Oil markets chilled on Monday, easing lower as odds of supply constraints drop.
- Fears of supply chain disruptions from Tropical Storm Beryl eased after storm downgrade.
- Barrel traders will be looking for a continuation of last week’s supply declines to bolster prices.
West Texas Intermediate (WTI) eased lower on Monday, bleeding bids as broad-market fears of supply disruptions from Tropical Storm Beryl have receded. The tropical storm, which initially made landfall in Texas as a category 1 hurricane, has been downgraded after wind speeds declined, and looks set to peter out without disrupting US domestic Crude Oil markets.
A risk bid from possible supply chain disruptions from Beryl helped to bolster Crude Oil prices last week. However, Monday’s updates to the storm’s projected dissipation has pulled technical support from beneath Crude bids, extending Friday’s declines and sending WTI down to $81.60.
Crude Oil markets will be looking for a continuation of last week’s sharp supply drawdown after both the American Petroleum Institute (API) and the Energy Information Administration (EIA) both post huge week-on-week contractions in US Crude Oil supplies. Energy investors will be looking for a repeat this week when the API reports Weekly Crude Oil Stocks on Tuesday, followed by EIA barrel counts on Wednesday.
Global energy markets continue to keep Crude Oil prices bid on long-running hopes of a broad uptick in fossil fuel demand, but after a half-year of flubbed sparks in demand upticks, analysts are beginning to express skepticism about the accuracy of demand growth projections from the Organization of the Petroleum Exporting Countries (OPEC). Global Crude Oil demand forecasts were initially built upon a foundation of easing global interest rates, a trend that has failed to materialize through 2024.
WTI technical outlook
WTI US Crude Oil has eased back below the 200-hour Exponential Moving Average (EMA) at $82.14, testing close to a familiar technical inflection point at $81.50. WTI flubbed a bullish push into fresh near-term highs last week, falling just short of reclaiming the $84.00 handle and easing back into recent technical levels.
Daily candlesticks are set to finish an unceremonious end to a recent bullish break north of a near-term congestion zone. An extended backslide will see WTI bids challenging the 200-day EMA at $79.29 once more.
WTI hourly chart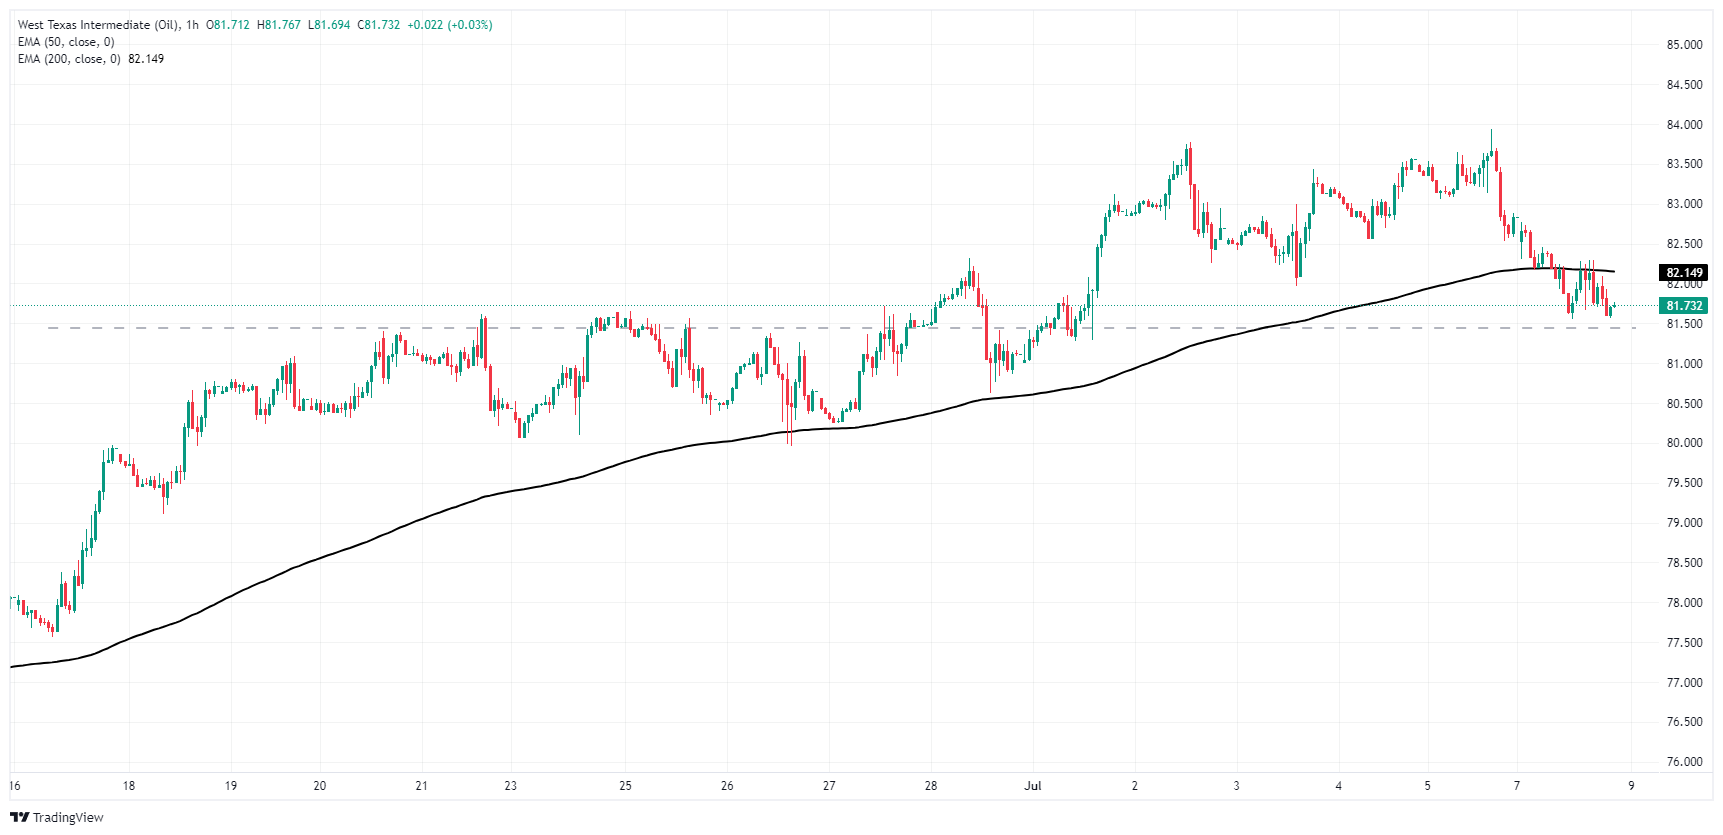
WTI daily chart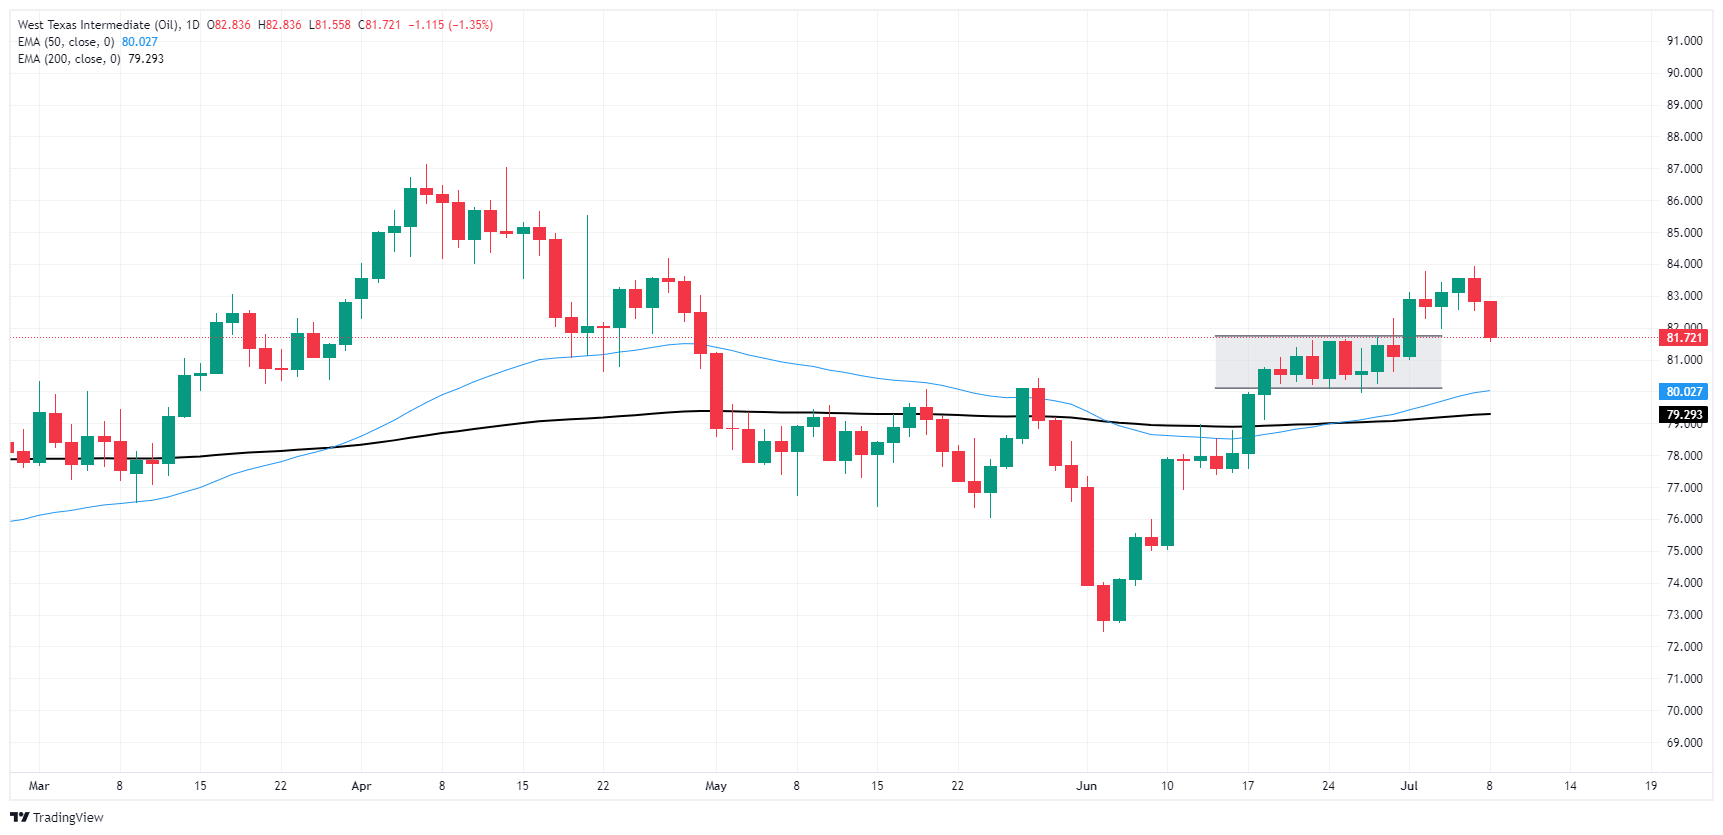
WTI Oil FAQs
WTI Oil is a type of Crude Oil sold on international markets. The WTI stands for West Texas Intermediate, one of three major types including Brent and Dubai Crude. WTI is also referred to as “light” and “sweet” because of its relatively low gravity and sulfur content respectively. It is considered a high quality Oil that is easily refined. It is sourced in the United States and distributed via the Cushing hub, which is considered “The Pipeline Crossroads of the World”. It is a benchmark for the Oil market and WTI price is frequently quoted in the media.
Like all assets, supply and demand are the key drivers of WTI Oil price. As such, global growth can be a driver of increased demand and vice versa for weak global growth. Political instability, wars, and sanctions can disrupt supply and impact prices. The decisions of OPEC, a group of major Oil-producing countries, is another key driver of price. The value of the US Dollar influences the price of WTI Crude Oil, since Oil is predominantly traded in US Dollars, thus a weaker US Dollar can make Oil more affordable and vice versa.
The weekly Oil inventory reports published by the American Petroleum Institute (API) and the Energy Information Agency (EIA) impact the price of WTI Oil. Changes in inventories reflect fluctuating supply and demand. If the data shows a drop in inventories it can indicate increased demand, pushing up Oil price. Higher inventories can reflect increased supply, pushing down prices. API’s report is published every Tuesday and EIA’s the day after. Their results are usually similar, falling within 1% of each other 75% of the time. The EIA data is considered more reliable, since it is a government agency.
OPEC (Organization of the Petroleum Exporting Countries) is a group of 13 Oil-producing nations who collectively decide production quotas for member countries at twice-yearly meetings. Their decisions often impact WTI Oil prices. When OPEC decides to lower quotas, it can tighten supply, pushing up Oil prices. When OPEC increases production, it has the opposite effect. OPEC+ refers to an expanded group that includes ten extra non-OPEC members, the most notable of which is Russia.
Information on these pages contains forward-looking statements that involve risks and uncertainties. Markets and instruments profiled on this page are for informational purposes only and should not in any way come across as a recommendation to buy or sell in these assets. You should do your own thorough research before making any investment decisions. FXStreet does not in any way guarantee that this information is free from mistakes, errors, or material misstatements. It also does not guarantee that this information is of a timely nature. Investing in Open Markets involves a great deal of risk, including the loss of all or a portion of your investment, as well as emotional distress. All risks, losses and costs associated with investing, including total loss of principal, are your responsibility. The views and opinions expressed in this article are those of the authors and do not necessarily reflect the official policy or position of FXStreet nor its advertisers. The author will not be held responsible for information that is found at the end of links posted on this page.
If not otherwise explicitly mentioned in the body of the article, at the time of writing, the author has no position in any stock mentioned in this article and no business relationship with any company mentioned. The author has not received compensation for writing this article, other than from FXStreet.
FXStreet and the author do not provide personalized recommendations. The author makes no representations as to the accuracy, completeness, or suitability of this information. FXStreet and the author will not be liable for any errors, omissions or any losses, injuries or damages arising from this information and its display or use. Errors and omissions excepted.
The author and FXStreet are not registered investment advisors and nothing in this article is intended to be investment advice.
Recommended content
Editors’ Picks
AUD/USD mildly down ahead of US inflation data

The AUD/USD saw some losses on Monday against the USD, which still remains weak after last week's data, which fueled dovish expectations for the Federal Reserve. With the pair maintaining its highest level since early January, the upside for the Aussie is limited by strong data reported last week.
EUR/USD faces initial up-barrier near 1.0850

EUR/USD halted its multi-day advance on Monday, facing some renewed downward pressure after faltering around the 1.0850 region on the back of the resurgence of the buying interest in the Greenback.
Gold price plummets as US yields drop and China stops bullion buying

The Gold price made a U-turn on Monday, trimming some of last Friday's gains and tanking more than 1% as risk appetite returned. US equities posted gains, while US Treasury bond yields edged lower. The XAU/USD trades around $2,358 after hitting a daily high of $2,391.
Here's what's happened in Solana today

Solana kicked off the new week with a lot of action on Monday after Cboe filed VanEck and 21Shares' Solana ETF application. Meanwhile, SOL surpassed Ethereum and Arbitrum in 24-hour decentralized exchange volume due to increased trading on the Raydium protocol.
Euro and Pound do good job absorbing political risk

A political gridlock in France and strong reassurances from the incoming UK government seem to have been enough to keep the Euro and Pound supported into this latest rally. Currencies have been better bid across the board, mostly on the back of a fresh wave of US Dollar selling.