- WTI edged back over $72.50 on Thursday as Crude Oil tries to recover more ground.
- Crude markets remain steeply off recent highs.
- Investors remain skeptical that production caps will undercut global demand declines.
West Texas Intermediate (WTI) has recovered additional ground on Thursday, extending a rebound sparked by a dovish pivot from the US Federal Reserve (Fed) on Wednesday that saw a broad-base market sentiment recovery, kicking off recovery rallies in the majority of asset classes and forcing the US Dollar (USD) into fresh lows.
A declining US Dollar, in tandem with rising market sentiment on the possibility of rate cuts from the Federal Reserve coming sooner rather than later, is helping to prop up Crude Oil prices heading into the tail end of the trading week.
With the Fed adjusting their dot plot of interest rate expectations to include several rate cuts in 2024 broader market sentiment is on the high side, dragging WTI back above the $70.00 handle, but bearish pressure has been building into Crude Oil markets since falling from late September’s highs just below the $94.00 handle.
The Organization for the Petroleum Exporting Countries (OPEC) has affirmed its dedication to extreme production cuts, at least at the administrative level; in practice, the oil cartel has no structural policy tools to force member states to adhere to production caps, nor is there any punishment for OPEC members that violate exporting quotas.
Energy markets remain skeptical that OPEC’s headline production cuts will be able to undercut declining global crude demand, especially as demand slumps in key oil-using markets such as China. Despite this, Energy Information Administration (EIA) barrel counts unexpectedly declined this week, with a 4.259 million barrel drawdown in US Crude Oil reserves for the week ended December 8. Markets had initially expected a slight decline of only 650K barrels, and the overhead declines add to the previous week’s drawdown of 4.632 million crude barrels.
WTI Technical Outlook
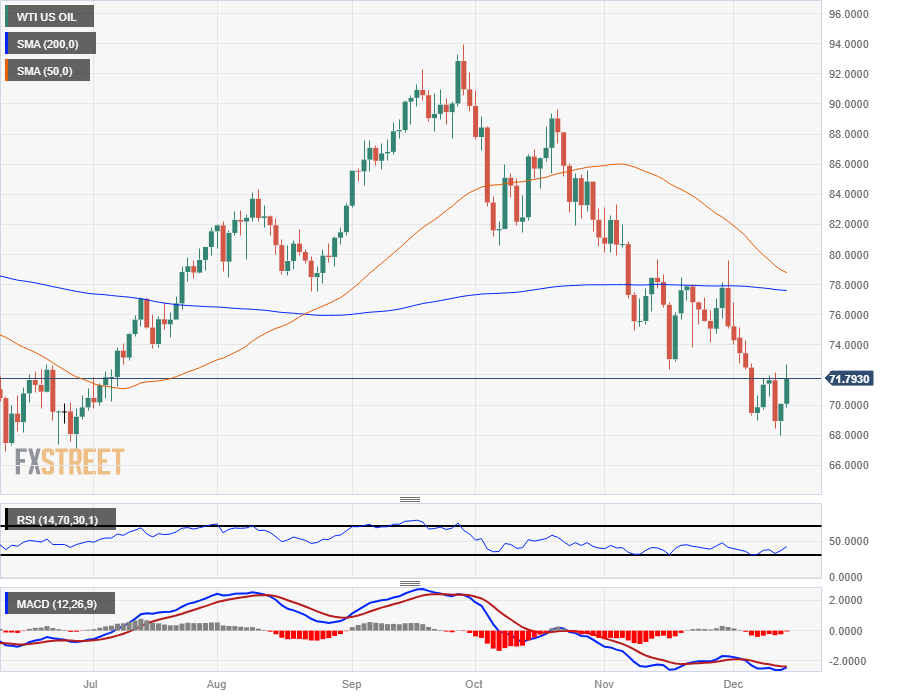
WTI’s rebound comes at the tail end of a very bearish run down the charts, and US Crude Oil is down nearly 24% from late September’s peak of $93.98. WTI has closed in the red for seven straight weeks.
Despite the near-term technical recovery, WTI remains deep inside bear country with the 200-day Simple Moving Average (SMA) high above current price action near the $78.00 handle. The 50-day SMA is firmly bearish, and is accelerating into a downside cross of the 200-day SMA which would provide stiff technical resistance for any bullish extensions beyond the $74.00 level.
WTI Daily Chart
WTI Technical Levels
Information on these pages contains forward-looking statements that involve risks and uncertainties. Markets and instruments profiled on this page are for informational purposes only and should not in any way come across as a recommendation to buy or sell in these assets. You should do your own thorough research before making any investment decisions. FXStreet does not in any way guarantee that this information is free from mistakes, errors, or material misstatements. It also does not guarantee that this information is of a timely nature. Investing in Open Markets involves a great deal of risk, including the loss of all or a portion of your investment, as well as emotional distress. All risks, losses and costs associated with investing, including total loss of principal, are your responsibility. The views and opinions expressed in this article are those of the authors and do not necessarily reflect the official policy or position of FXStreet nor its advertisers. The author will not be held responsible for information that is found at the end of links posted on this page.
If not otherwise explicitly mentioned in the body of the article, at the time of writing, the author has no position in any stock mentioned in this article and no business relationship with any company mentioned. The author has not received compensation for writing this article, other than from FXStreet.
FXStreet and the author do not provide personalized recommendations. The author makes no representations as to the accuracy, completeness, or suitability of this information. FXStreet and the author will not be liable for any errors, omissions or any losses, injuries or damages arising from this information and its display or use. Errors and omissions excepted.
The author and FXStreet are not registered investment advisors and nothing in this article is intended to be investment advice.
Recommended content
Editors’ Picks

EUR/USD stays near 1.0400 in thin holiday trading
EUR/USD trades with mild losses near 1.0400 on Tuesday. The expectation that the US Federal Reserve will deliver fewer rate cuts in 2025 provides some support for the US Dollar. Trading volumes are likely to remain low heading into the Christmas break.

GBP/USD struggles to find direction, holds steady near 1.2550
GBP/USD consolidates in a range at around 1.2550 on Tuesday after closing in negative territory on Monday. The US Dollar preserves its strength and makes it difficult for the pair to gain traction as trading conditions thin out on Christmas Eve.

Gold holds above $2,600, bulls non-committed on hawkish Fed outlook
Gold trades in a narrow channel above $2,600 on Tuesday, albeit lacking strong follow-through buying. Geopolitical tensions and trade war fears lend support to the safe-haven XAU/USD, while the Fed’s hawkish shift acts as a tailwind for the USD and caps the precious metal.

IRS says crypto staking should be taxed in response to lawsuit
In a filing on Monday, the US International Revenue Service stated that the rewards gotten from staking cryptocurrencies should be taxed, responding to a lawsuit from couple Joshua and Jessica Jarrett.

2025 outlook: What is next for developed economies and currencies?
As the door closes in 2024, and while the year feels like it has passed in the blink of an eye, a lot has happened. If I had to summarise it all in four words, it would be: ‘a year of surprises’.

Best Forex Brokers with Low Spreads
VERIFIED Low spreads are crucial for reducing trading costs. Explore top Forex brokers offering competitive spreads and high leverage. Compare options for EUR/USD, GBP/USD, USD/JPY, and Gold.