Crude Oil fades in US trading session on Friday with downside pressure active
- Crude Oil falls to $69.00 into the US trading session.
- US Crude production arose to a whopping 13.5 million barrels per day, according to Bloomberg.
- The US Dollar Index eases a touch ahead of the 104.00 marker for this week.

Crude Oil falls over 1% again, making it nearly full losing week for Crude Oil, seeing the latest headlines. Overnight data revealed that China’s steel output and Oil refining continued to slump in October. The Oil refining output fell to a three-month low because domestic demand is simply nonexistent.
The US Dollar Index (DXY), which tracks the performance of the Greenback against six other currencies, also consolidates on Friday after a steep rally this week. The rally was fueled for the most part by former US President Donald Trump, who took the lead in some polls ahead of the November 5 presidential elections. That was enough for market participants to start positioning for a Trump win on November 5, with the Greenback rallying nearly the whole week. However, according to FiveThirtyEight, US Vice President and Democrat nominee Kamala Harris is leading polls by 2.4 percentage points, suggesting a neck-to-neck competition between both candidates.
At the time of writing, Crude Oil (WTI) trades at $69.15 and Brent Crude at $7321
Oil news and market movers: Demand side is dislocated to the supply side
- Overnight data from China revealed that steel and oil were the worst performing sectors for the country this year, Bloomberg reported.
- The Energy Information Administration (EIA) has reported that a whopping 13.5 million barrels per day are produced by the US. Meanwhile, the US Crude Oil stockpile change came in at a draw of 2.191 million barrels in the week ending on October 11, compared to the prior week’s build of 5.81 million barrels, Reuters reports.
- At 17:00 GMT, the Baker Hughes US Oil Rig Count will be released. Last week, 481 rigs were still operating despite the hurricanes in the Gulf Region.
Oil Technical Analysis: Think geopolitics away and outlook remains bleak
When broken down into several drivers, Crude Oil’s price action clearly sees two defining factors: geopolitics and fundamentals. When stripping away the geopolitical element, the fundamentals clearly point to more downside for Crude Oil for at least the remainder of 2024. With another production record for the US, and once geopolitical pressure eases off, Crude could implode again easily as it did this week.
There is a challenging path to recovery for Crude Oil in the coming days. First, the pivotal level at $71.46, which was strong enough to catch the falling knife on Monday, must be regained again with a daily close above it. Once from there, the hefty technical level at $75.20, with the 100-day Simple Moving Average (SMA) and a few pivotal lines, is possibly the first big hurdle ahead.
On the downside, that previously mentioned $71.46 pivotal level has now turned into resistance and no longer has any value as support. Instead, traders need to look much lower, at $67.11, a level that supported the price in May-June 2023. In case that level breaks, the 2024 year-to-date low emerges at $64.75 followed by $64.38, the low of 2023.
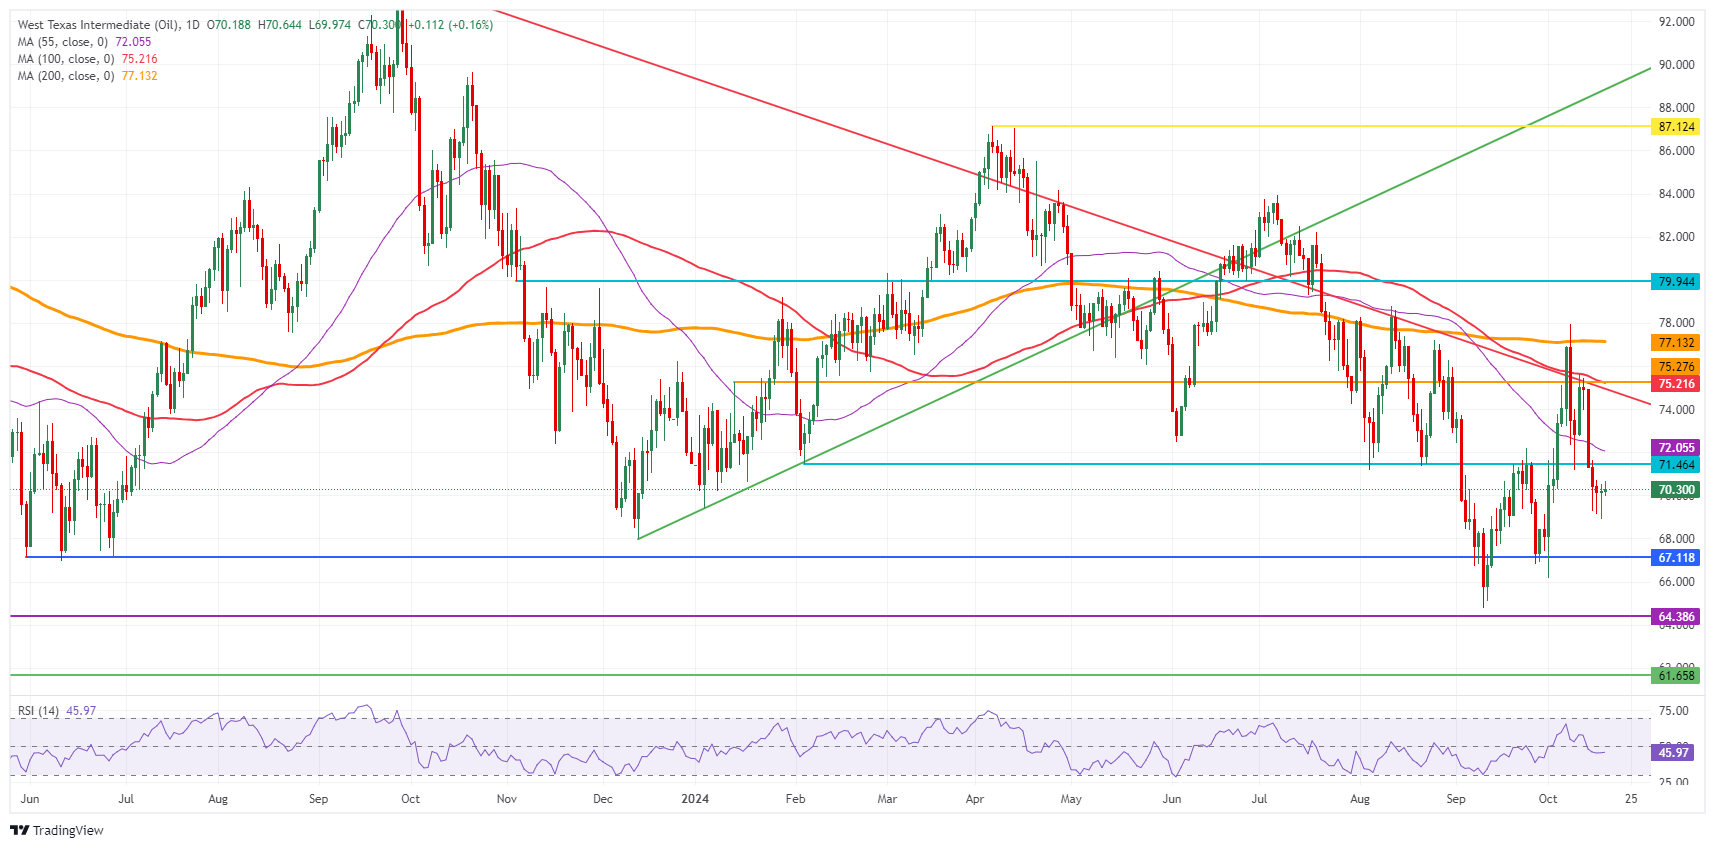
US WTI Crude Oil: Daily Chart
WTI Oil FAQs
WTI Oil is a type of Crude Oil sold on international markets. The WTI stands for West Texas Intermediate, one of three major types including Brent and Dubai Crude. WTI is also referred to as “light” and “sweet” because of its relatively low gravity and sulfur content respectively. It is considered a high quality Oil that is easily refined. It is sourced in the United States and distributed via the Cushing hub, which is considered “The Pipeline Crossroads of the World”. It is a benchmark for the Oil market and WTI price is frequently quoted in the media.
Like all assets, supply and demand are the key drivers of WTI Oil price. As such, global growth can be a driver of increased demand and vice versa for weak global growth. Political instability, wars, and sanctions can disrupt supply and impact prices. The decisions of OPEC, a group of major Oil-producing countries, is another key driver of price. The value of the US Dollar influences the price of WTI Crude Oil, since Oil is predominantly traded in US Dollars, thus a weaker US Dollar can make Oil more affordable and vice versa.
The weekly Oil inventory reports published by the American Petroleum Institute (API) and the Energy Information Agency (EIA) impact the price of WTI Oil. Changes in inventories reflect fluctuating supply and demand. If the data shows a drop in inventories it can indicate increased demand, pushing up Oil price. Higher inventories can reflect increased supply, pushing down prices. API’s report is published every Tuesday and EIA’s the day after. Their results are usually similar, falling within 1% of each other 75% of the time. The EIA data is considered more reliable, since it is a government agency.
OPEC (Organization of the Petroleum Exporting Countries) is a group of 12 Oil-producing nations who collectively decide production quotas for member countries at twice-yearly meetings. Their decisions often impact WTI Oil prices. When OPEC decides to lower quotas, it can tighten supply, pushing up Oil prices. When OPEC increases production, it has the opposite effect. OPEC+ refers to an expanded group that includes ten extra non-OPEC members, the most notable of which is Russia.
Author

Filip Lagaart
FXStreet
Filip Lagaart is a former sales/trader with over 15 years of financial markets expertise under its belt.


