- WTI tumbled back below $81.00 on Friday, tested $81.50.
- The EIA reported a surprise buildup in natural gas reserves, clipping drawdown hopes.
- US Crude Oil productivity remains close to all-time highs.
West Texas Intermediate (WTI) US Crude Oil hit a fresh high for the week early Friday before slumping back into negative territory for the day after the Energy Information Administration (EIA) noted that US Crude Oil production remains near all-time peaks and a larger-than-expected buildup in Natural Gas reserves.
The EIA reported a 71 billion cubic feet (Bcf) increase in the amount of available working natural gas in storage, bringing US reserves to a multi-month high of 3,045 Bcf for the week ended June 14. The previous week’s increase of 74 Bcf was expected to a steeper drop in buildup to only 69 Bcf.
With natural gas reserves filling up ahead of peak summertime cooling demand, Crude Oil is less likely to see meaningful increases in demand, trimming hopes of a steeper drawdown during the summer.
US Purchasing Managers Index (PMI) figures for June also beat the street on Friday, pressing down on broad-market hopes for rate cuts. With the Federal Reserve (Fed) unlikely to get forced into an accelerated pace of rate cuts in 2024, Crude Oil markets are second-guessing near-term bullishness as investors lean deeply into rate trim hopes to ease lending and financing costs.
WTI technical outlook
Hesitating bulls have crimped topside momentum in WTI on Friday, dragging intraday price action back into range of near-term rising trendlines. Firmer technical support is sitting at the 200-hour Exponential Moving Average (EMA) at $79.35. Despite a hesitation in the second-half of Friday’s US market session, US Crude Oil managed to etch out a fresh seven-week high above $81.60 before settling lower.
Daily candlesticks are beginning to show signs of exhaustion as WTI’s technical recovery above the 200-day EMA at $78.87 begins to run out of steam. Barring a resurgence in firm bidding, WTI could be primed for a tumble back to the last swing low near $72.50.
WTI hourly chart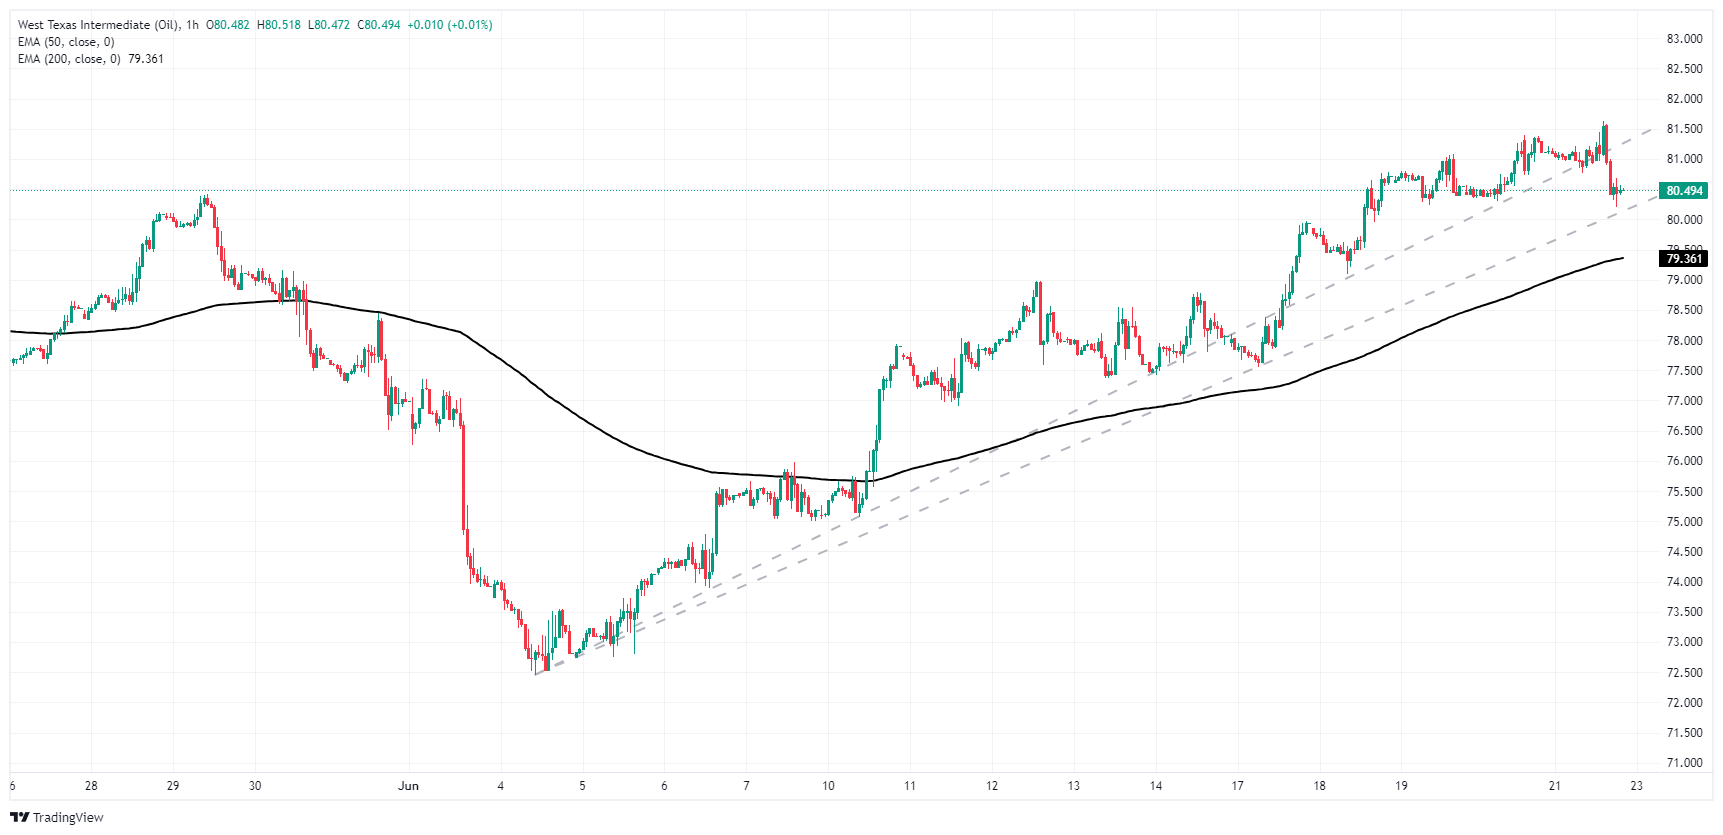
WTI daily chart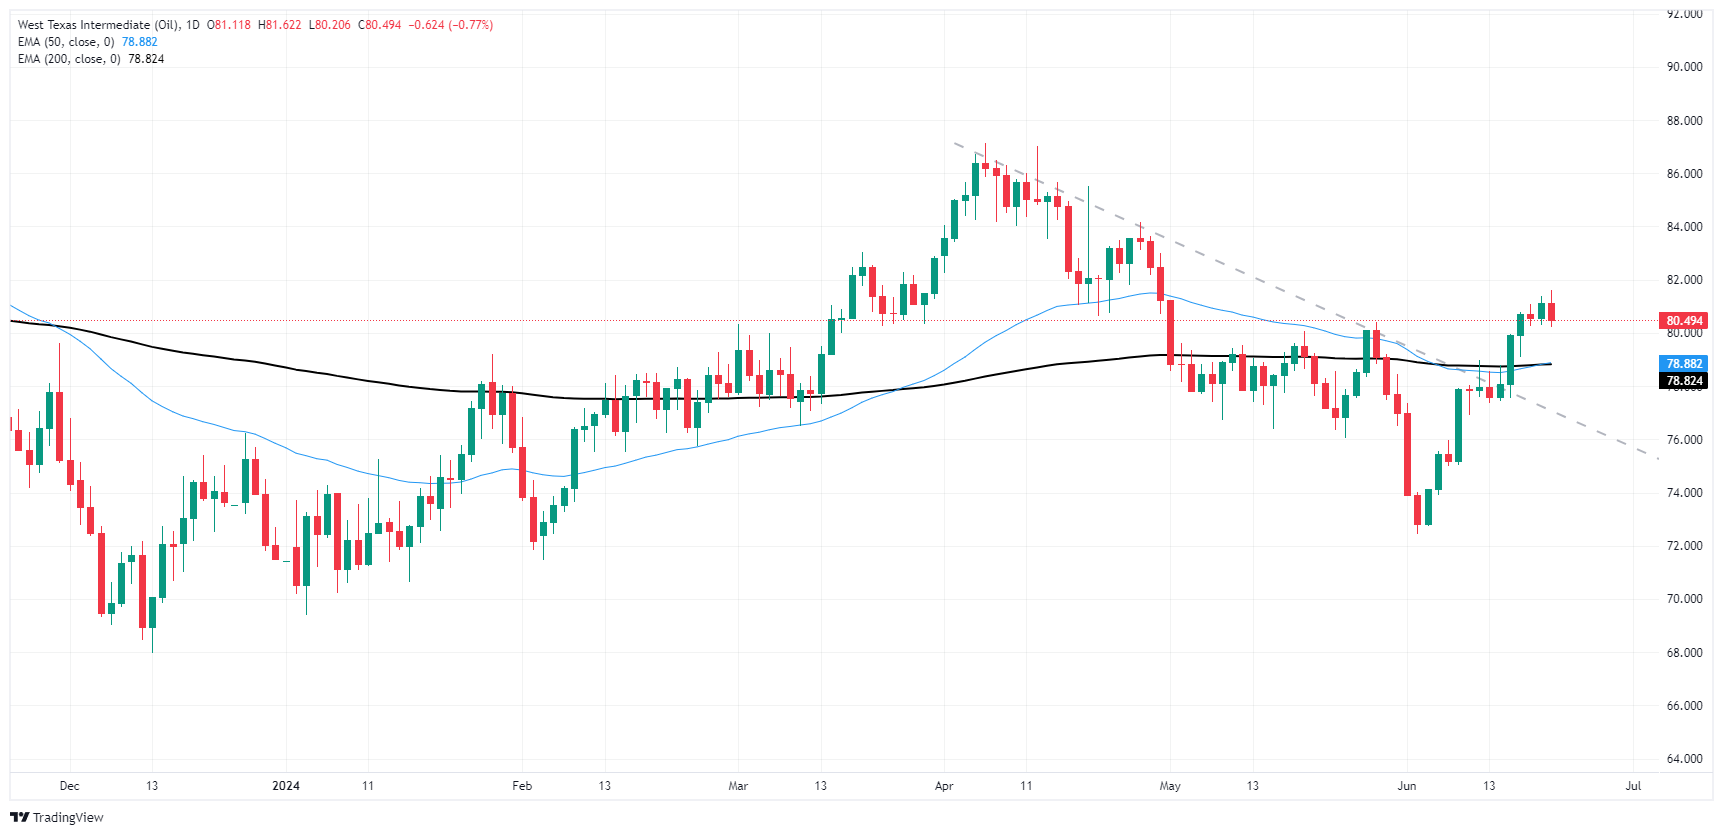
WTI Oil FAQs
WTI Oil is a type of Crude Oil sold on international markets. The WTI stands for West Texas Intermediate, one of three major types including Brent and Dubai Crude. WTI is also referred to as “light” and “sweet” because of its relatively low gravity and sulfur content respectively. It is considered a high quality Oil that is easily refined. It is sourced in the United States and distributed via the Cushing hub, which is considered “The Pipeline Crossroads of the World”. It is a benchmark for the Oil market and WTI price is frequently quoted in the media.
Like all assets, supply and demand are the key drivers of WTI Oil price. As such, global growth can be a driver of increased demand and vice versa for weak global growth. Political instability, wars, and sanctions can disrupt supply and impact prices. The decisions of OPEC, a group of major Oil-producing countries, is another key driver of price. The value of the US Dollar influences the price of WTI Crude Oil, since Oil is predominantly traded in US Dollars, thus a weaker US Dollar can make Oil more affordable and vice versa.
The weekly Oil inventory reports published by the American Petroleum Institute (API) and the Energy Information Agency (EIA) impact the price of WTI Oil. Changes in inventories reflect fluctuating supply and demand. If the data shows a drop in inventories it can indicate increased demand, pushing up Oil price. Higher inventories can reflect increased supply, pushing down prices. API’s report is published every Tuesday and EIA’s the day after. Their results are usually similar, falling within 1% of each other 75% of the time. The EIA data is considered more reliable, since it is a government agency.
OPEC (Organization of the Petroleum Exporting Countries) is a group of 13 Oil-producing nations who collectively decide production quotas for member countries at twice-yearly meetings. Their decisions often impact WTI Oil prices. When OPEC decides to lower quotas, it can tighten supply, pushing up Oil prices. When OPEC increases production, it has the opposite effect. OPEC+ refers to an expanded group that includes ten extra non-OPEC members, the most notable of which is Russia.
Information on these pages contains forward-looking statements that involve risks and uncertainties. Markets and instruments profiled on this page are for informational purposes only and should not in any way come across as a recommendation to buy or sell in these assets. You should do your own thorough research before making any investment decisions. FXStreet does not in any way guarantee that this information is free from mistakes, errors, or material misstatements. It also does not guarantee that this information is of a timely nature. Investing in Open Markets involves a great deal of risk, including the loss of all or a portion of your investment, as well as emotional distress. All risks, losses and costs associated with investing, including total loss of principal, are your responsibility. The views and opinions expressed in this article are those of the authors and do not necessarily reflect the official policy or position of FXStreet nor its advertisers. The author will not be held responsible for information that is found at the end of links posted on this page.
If not otherwise explicitly mentioned in the body of the article, at the time of writing, the author has no position in any stock mentioned in this article and no business relationship with any company mentioned. The author has not received compensation for writing this article, other than from FXStreet.
FXStreet and the author do not provide personalized recommendations. The author makes no representations as to the accuracy, completeness, or suitability of this information. FXStreet and the author will not be liable for any errors, omissions or any losses, injuries or damages arising from this information and its display or use. Errors and omissions excepted.
The author and FXStreet are not registered investment advisors and nothing in this article is intended to be investment advice.
Recommended content
Editors’ Picks
EUR/USD struggles to recover above 1.0900 as markets remain cautious

EUR/USD stays on the back foot and trades below 1.0900 following Thursday's sharp decline. Dovish comments from European Central Bank officials and the risk-averse market atmosphere make it difficult for the pair to stage a rebound on Friday.
GBP/USD falls toward 1.2900, looks to post weekly losses

GBP/USD continues to push lower toward 1.2900 in the American session on Friday. Disappointing Retail Sales data from the UK, combined with the US Dollar (USD) recovery amid souring mood, causes the pair to stay under bearish pressure ahead of the weekend.
Gold extends daily slide, trades near $2,400

Gold's correction from the record-high set earlier in the week deepens on Friday. With the US Dollar (USD) benefiting from safe-haven flows and the 10-year US yield holding steady above 4.2%, XAU/USD tests $2,400 and looks to post small weekly losses
Top 10 crypto market movers as Bitcoin and Ethereum hold steady ahead of $1.8 billion options expiry

Bitcoin and Ethereum hold steady above $64,000 and $3,400 as $1.8 billion in options expire on Friday. WazirX hack of $230 million potentially linked to Lazarus Group ushers correction in Shiba Inu, among other assets.
Week ahead – Flash PMIs, US GDP and BoC decision on tap

US data awaited amid overly dovish Fed rate cut bets. July PMIs to reveal how economies entered H2. BoC decides on monetary policy, may cut rates again.