|

CROX reacted higher from blue box area and favors upside

Crocs Inc., (CROX) designs, manufactures, markets & distributes casual lifestyle footwear & accessories for men, women & children worldwide. The company sells its products in approximately 85 countries through wholesalers, retail stores, e-commerce sites & third-party marketplaces. It is based in Colorado, US, comes under Consumer Cyclical sector & trades as “CROX” ticker at Nasdaq.

CROX ended impulse Elliott Wave sequence as wave I at $183.88 high started from November-2008 low. Below there, it proposed ended wave II at $46.08 in zigzag correction ended in blue box area. It favors higher in ((1)) of III & expects further upside before pullback starts in ((2)) correction.

CROX – Elliott Wave latest weekly view

CROX

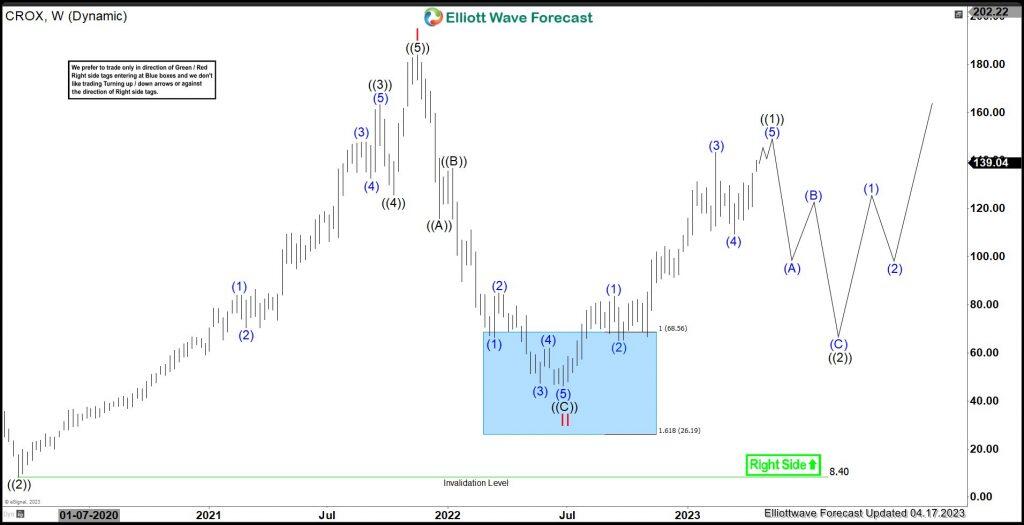
It made all time low at $0.79 in November-2008. It placed ((1)) of I at $32.47 high & ((2)) at $8.40 low as flat correction. Above there, it favored higher in ((3)) as extended sequence ended at $163.18 high. Wave ((4)) was shallow correction ended at $125.54 low as 0.236 Fibonacci retracement. Finally, it ended ((5)) as I at $183.88 high. Below I high, it placed ((A)) at $115.85 low & ((B)) at $136.81 high. Wave ((C)) of zigzag correction ended at $46.08 low within blue box area as II.

CROX – Elliott Wave latest daily view

Chart

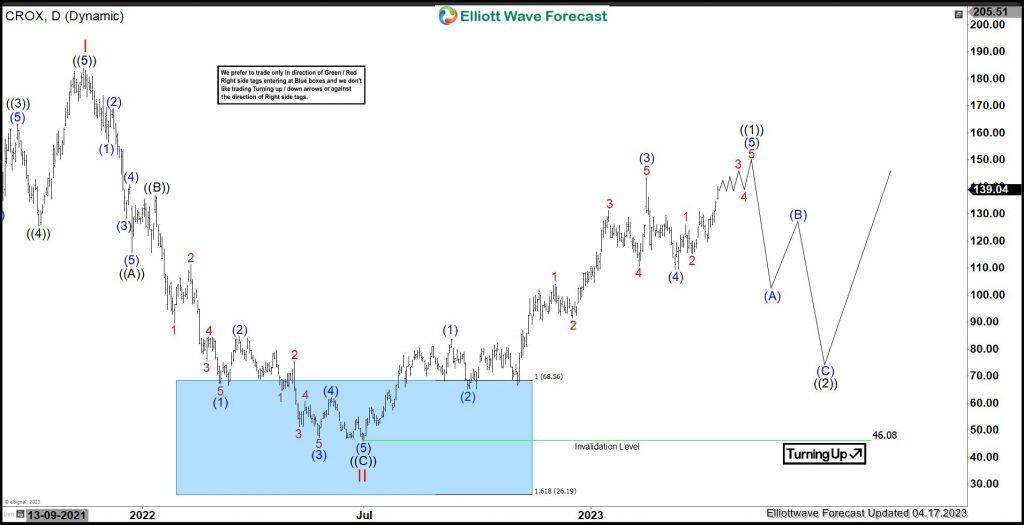
Above II low, it favors higher in ((1)) of III. III red will confirm above I high. It placed (1) at $83.64 high, (2) at $65.17 low, (3) at $143.50 high as extended sequence and (4) at $109.47 low as 0.382 Fibonacci retracement. Currently, it favors higher in 3 of (5) & expect new high above (3) to finish wave ((1)). Later it expects a larger pullback in ((2)) in 3, 7 or 11 swings, which remain supported above II low to resume higher. Buyers from the blue box area is already having risk free position.

Author

Elliott Wave Forecast Team

Elliott Wave Forecast Team

ElliottWave-Forecast.com

More from Elliott Wave Forecast Team
Share:

Editor's Picks

EUR/USD holds above 1.1750 after mixed EU PMI data

EUR/USD manages to hold above 1.1750 but struggles to gather recovery momentum on Friday, following the mixed February PMI figures from Germany and the Eurozone. In the second half of the day, Q4 GDP, December inflation and February PMI data from the US will be watched closely by market participants.

GBP/USD recovers further toward 1.3500 after UK PMI data

GBP/USD is recovering ground further toward 1.3500 in European trading on Friday, helped by a modest uptick in the Pound Sterling after stronger-than-expected UK January Retail Sales and February PMI data. However, the pair's further upside could be limited amid persistent US Dollar strength as the focus turns to key US data. 

Gold sticks to positive bias above $5,000 ahead of US data

Gold gains some positive traction for the third consecutive day on Friday. holding above $5,000. Traders now look forward to the key US macro releases – the Advance Q4 GDP report and the Personal Consumption Expenditures (PCE) Price Index – for fresh trading impetus. 

US GDP growth expected to slow down significantly in Q4 after stellar Q3 

The United States Bureau of Economic Analysis will publish the first preliminary estimate of the fourth-quarter Gross Domestic Product at 13:30 GMT. Analysts forecast the US economy to have expanded at a 3% annualized rate, slowing down from the 4.4% growth posted in the previous quarter.

Iran tensions and AI fears at the forefront ahead of key US data

Thursday’s scorecard shows major US Stock benchmarks closed modestly in the red amid mounting US-Iran tensions and AI disruption worries. The S&P 500 shed 19 points (0.3%) to 6,861, the Nasdaq 100 lost 101 points (0.4%) to 24,797, and the Dow Jones Industrial Average dropped 267 points (0.5%) to 49,395.

Official Trump price approaches breakout with mixed signals from traders

Official Trump (TRUMP) is trading at $3.50 at the time of writing, approaching its upper consolidation range. A breakout from this range could open the door for an upside move. On-chain data shows market indecision, with balanced flows between bulls and bears, signaling a lack of clear directional bias.