CrowdStrike Holdings, Inc. (CRWD) is an American cybersecurity technology company based in Austin, Texas. It provides cloud workload and endpoint security, threat intelligence, and cyberattack response services.
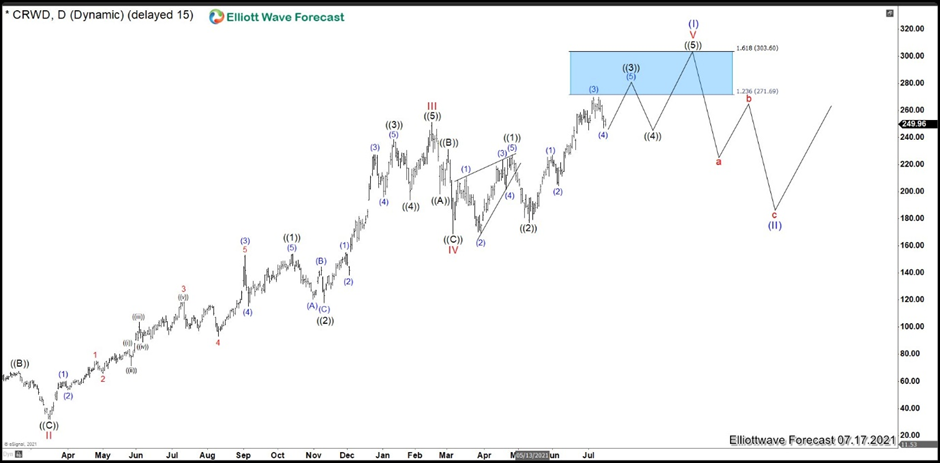
CrowdStrike (CRWD) July 2021 Daily Chart
The chart above shows the daily view that we forecast 3 years ago. We were expecting to end an very important market cycle in the blue box area between 303.60 – 271.69. This cycle would end an impulse on CRWD since it listed on the stock exchange. Once the impulse would end as wave (I), we expected a big correction as wave (II). (If you want to learn more about Elliott Wave Theory, follow these links: Elliott Wave Education and Elliott Wave Theory).
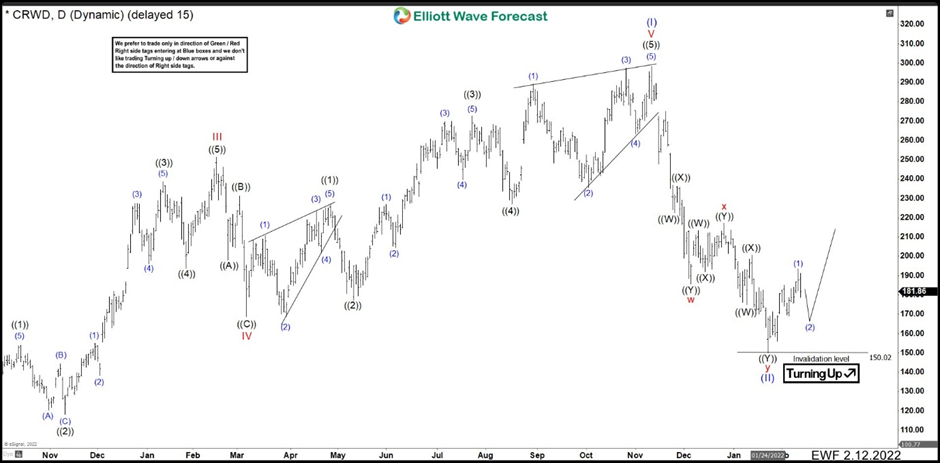
CrowdStrike (CRWD) February 2022 Daily Chart
Six months later, We can see the wave (I) ended in the proposed blue box area at 298.48 high developing an ending diagonal. The market reacted perfectly to the downside and we called completed a double correction as wave (II) at 150.02 low. Exactly at the 50% Fibonacci retracement, the stock bounce suggesting the pullback was over and the rally should continue to break 298.48 high in a new cycle.
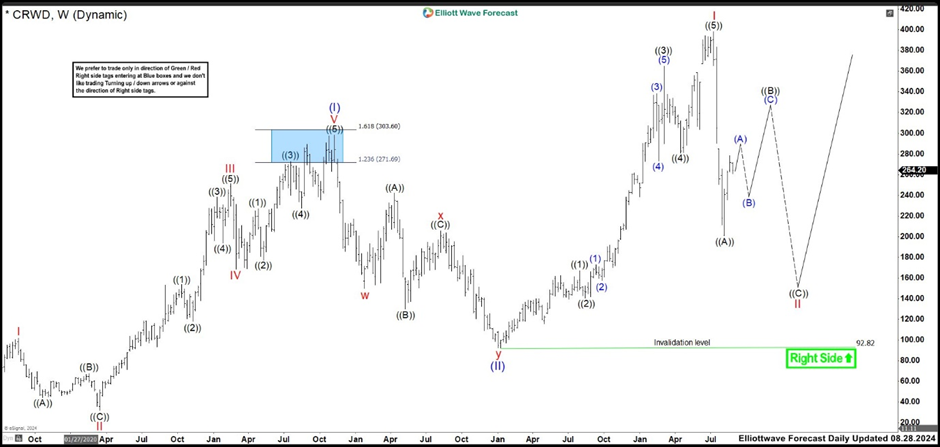
CrowdStrike (CRWD) August 2024 Daily Chart
After 3 years, we have above the current weekly chart. We can see the cycle we called completed the wave (II) at 150.02, it just was part of a bigger double correction. Therefore, the cycle that ended at 150.02 was wave “w”, then we have expanded flat correction as wave “x” ending at 205.73. Last push lower finished wave “y” at 92.25 low completing wave (II) pullback. The rally we thought went to start in Jan 2022, started at Jan 2023.
From 92.25 low, CRWD built a clear impulse to the upside. Wave ((1)) ended at 166.99 and pullback as wave ((2)) ended at 140.52 low. Then, it had a big rally reaching all time new highs at 365.00 ending wave ((3)). Wave ((4)) finished at 280.88 low and rally again to complete wave ((5)) at 398.33 and also wave I of (III). After this wave I, we can see a very sharp drop making the stock to lose 50% of his value. As last time, with this pullback wave II could be complete already. However, we are calling as part of a bigger wave II. The global market is showing some relative bullish exhaustion that could send the stock to see more downside. Wave ((A)) of wave II ended at 200.81 and we are expecting a corrective rally to stay below 398.33 high. Then market should resume lower in wave ((C)) of II to complete the structure before resuming to the upside.
FURTHER DISCLOSURES AND DISCLAIMER CONCERNING RISK, RESPONSIBILITY AND LIABILITY Trading in the Foreign Exchange market is a challenging opportunity where above average returns are available for educated and experienced investors who are willing to take above average risk. However, before deciding to participate in Foreign Exchange (FX) trading, you should carefully consider your investment objectives, level of xperience and risk appetite. Do not invest or trade capital you cannot afford to lose. EME PROCESSING AND CONSULTING, LLC, THEIR REPRESENTATIVES, AND ANYONE WORKING FOR OR WITHIN WWW.ELLIOTTWAVE- FORECAST.COM is not responsible for any loss from any form of distributed advice, signal, analysis, or content. Again, we fully DISCLOSE to the Subscriber base that the Service as a whole, the individual Parties, Representatives, or owners shall not be liable to any and all Subscribers for any losses or damages as a result of any action taken by the Subscriber from any trade idea or signal posted on the website(s) distributed through any form of social-media, email, the website, and/or any other electronic, written, verbal, or future form of communication . All analysis, trading signals, trading recommendations, all charts, communicated interpretations of the wave counts, and all content from any media form produced by www.Elliottwave-forecast.com and/or the Representatives are solely the opinions and best efforts of the respective author(s). In general Forex instruments are highly leveraged, and traders can lose some or all of their initial margin funds. All content provided by www.Elliottwave-forecast.com is expressed in good faith and is intended to help Subscribers succeed in the marketplace, but it is never guaranteed. There is no “holy grail” to trading or forecasting the market and we are wrong sometimes like everyone else. Please understand and accept the risk involved when making any trading and/or investment decision. UNDERSTAND that all the content we provide is protected through copyright of EME PROCESSING AND CONSULTING, LLC. It is illegal to disseminate in any form of communication any part or all of our proprietary information without specific authorization. UNDERSTAND that you also agree to not allow persons that are not PAID SUBSCRIBERS to view any of the content not released publicly. IF YOU ARE FOUND TO BE IN VIOLATION OF THESE RESTRICTIONS you or your firm (as the Subscriber) will be charged fully with no discount for one year subscription to our Premium Plus Plan at $1,799.88 for EACH person or firm who received any of our content illegally through the respected intermediary’s (Subscriber in violation of terms) channel(s) of communication.
Recommended content
Editors’ Picks

AUD/USD: Further recovery in the pipeline
AUD/USD set aside Friday’s retracement and headed towards the 0.6800 region on quite a firm pace, always in response to renewed weakness in the Greenback and despite poor prints from Chinese fundamentals and lower commodity prices.

USD/JPY surges to two-week peak, shy of 147.00
The USD/JPY rises for the fourth straight day on Monday as September commences, up by 0.49% amid thin liquidity conditions during the North American session. At the time of writing, the pair trades at 146.87 after bouncing off a daily low of 145.78.

Gold battles to retain the $2,500 mark
Gold struggles to find direction on Monday as it continues to move up and down at around $2,500. Later in the week, key macroeconomic data releases from the US, including August PMI figures and the jobs report, could trigger the next big action in XAU/USD.

Ethereum's weak average September returns make investors wary amid ETF outflows
Ethereum (ETH) is up 2% on Monday despite negative sentiment around ETH's historical weak price action in September. Meanwhile, ETH ETFs continue their weak trend, recording another week of net outflows.

Week ahead: US labour data and the BoC rate announcement in focus
With US Federal Reserve Chair Jerome Powell’s recent speech at the Jackson Hole Symposium confirming that it is time to begin easing policy as well as underlining the importance of the jobs market, this week’s jobs data may help determine how the Fed approaches its easing cycle.

Moneta Markets review 2024: All you need to know
VERIFIED In this review, the FXStreet team provides an independent and thorough analysis based on direct testing and real experiences with Moneta Markets – an excellent broker for novice to intermediate forex traders who want to broaden their knowledge base.


