|

Costco Wholesale (COST) continues further upside and remain supported

Costco Wholesale Corporation., (COST) engages in the operation of membership warehouse in the United States, Puerto Rico, Canada, United Kingdom, Mexico, Japan, Korea, Australia, Spain, France, Iceland, China & Taiwan together with its subsidiaries. It offers branded & private label products in the range of merchandise categories. It also operates e-commerce websites in the US, Canada, UK & many other countries. It is based in Issaquah, Washington, comes under Consumer Defensive sector & trades as “COST” ticker at Nasdaq.

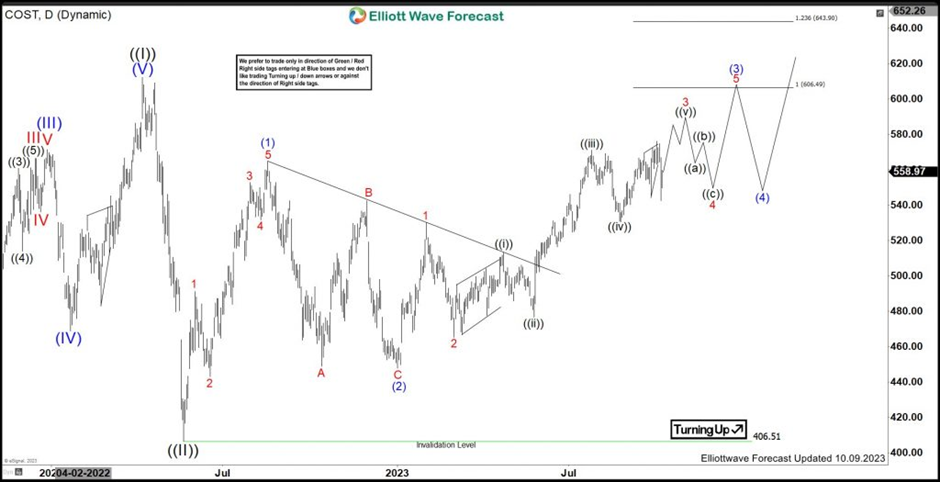
As shown from the previous article, COST extend higher in 3 of (3). It favors small upside in ((v)) to finish 3 of (3) soon before correcting in 4 as the part of ((1)).

COST – Elliott Wave view from 10.09.2023

Chart

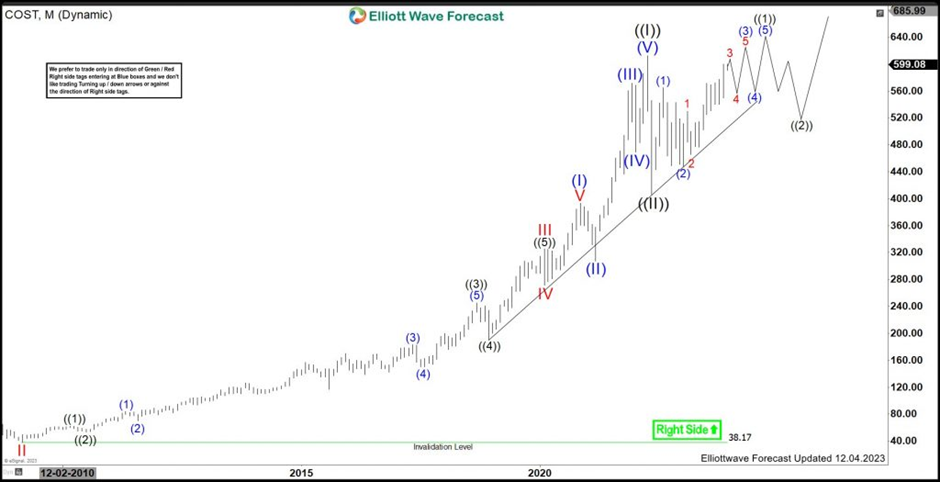
In Monthly sequence, it finished (I) at $393.15 high in November-2020 & corrected in (II) at $307 low in March-2021. It continued higher in (III) ended at $571.49 high in December-2021. It corrected in (IV) at $469.01 low as 0.382 Fibonacci retracement. Finally, it ended (V) at $612.27 high as ((I)) in April-2022 high as bullish impulse sequence since 1986 low. It corrected lower in ((II)) which, ended at $406.51 as sharp pullback.

COST – Elliott Wave latest daily view

Chart

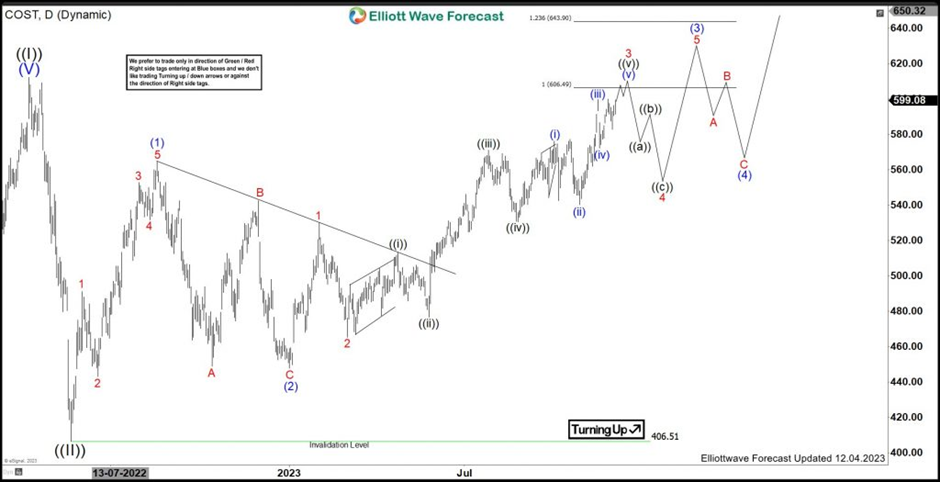
Above ((II)) low, it placed (2) of ((1)) at $447.90 low as zigzag correction & 2 of (3) at $465.33 low. It favors higher in ((v)) of 3 of (3), while placed ((iv)) at $530.56 low. Within ((v)), it placed (i) at $576.19 high, (ii) at $540.23, (iii) at 599.89 high & (iv) at $572.24 low. Currently, it favors higher in (v) of ((v)) & expect to end as diagonal in ((v)) in 3 of (3). Later, it expects to pullback in 4 in 3, 7 or 11 swings followed by resumes higher in 5 of (3) of ((1)) & remain choppy to higher.

COST – Elliott Wave latest monthly view

Chart

Author

Elliott Wave Forecast Team

Elliott Wave Forecast Team

ElliottWave-Forecast.com

More from Elliott Wave Forecast Team
Share:

Editor's Picks

EUR/USD looks weak below 1.1800

EUR/USD has slipped back under pressure, breaking through the 1.1800 support and drifting towards the weekly lows near 1.1770 ahead of the opening bell in Asia. The move reflects renewed strength in the US Dollar, with steady geopolitical tensions keeping its demand firm. Moving forward, the release of the German labour market report and flash inflation figures should keep European investors entertained on Friday.
 

GBP/USD threatens the 200-day SMA near 1.3440

GBP/USD rapidly leaves behind Wednesday’s strong advance, coming under heavy pressure and retesting the 1.3440 zone, where the critical 200-day SMA is located. Cable’s deep pullback follows the strong gains in the Greenback, while investors continue to pencil in a potential BoE rate cut in March.

Gold trims gains, slips back to around $5,170

Gold is now facing some downside pressure, hovering around the $5,170 region on Thursday. The yellow metal surrenders part of its earlier gains on the back of the resurgence of the buying interest in the Greenback. In the meantime, geopolitical tensions in the Middle East continue to limit the downside potential for now.

How AI, blockchain, stablecoins are shaping a new global economy – Circle CEO Jeremy Allaire

Artificial Intelligence (AI), blockchain technology and stablecoins are emerging as core pillars of a new global economic system, according to Circle’s CEO, Jeremy Allaire.

Changing the game: International implications of recent tariff developments

The Supreme Court ruling on International Emergency Economic Powers Act (IEEPA) tariffs provides limited relief for the rest of the world, with weighted average tariff rates modestly lower.

Bitcoin steadies as traders eye US–Iran talks

Bitcoin (BTC) price is stabilizing around $68,000 at the time of writing on Thursday after a 6.2% relief rally the previous day amid a broader downward trend.