Costco Wholesale Corp (COST) Elliott Wave technical analysis [Video]
![Costco Wholesale Corp (COST) Elliott Wave technical analysis [Video]](https://editorial.fxstreet.com/images/Markets/Equities/Industries/ConsumerServices/pic-man-call-center-637435344352918424_XtraLarge.jpg)
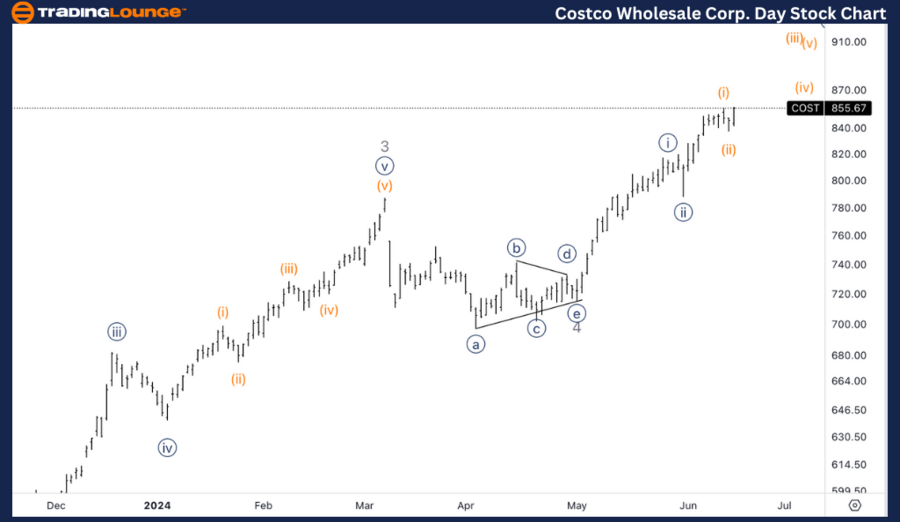
COST Elliott Wave Analysis Trading Lounge Daily Chart,
Costco Wholesale Corp., (COST) Daily Chart.
COST Elliott Wave technical analysis
Function: Trend.
Mode: Impulsive.
Structure: Motive.
Position: Wave 5.
Direction: Upside in wave {iii}.
Details: Looking for upside into wave {iii} as we seem to have completed wave {ii} of 5 after successfully completing the triangle in wave 4.
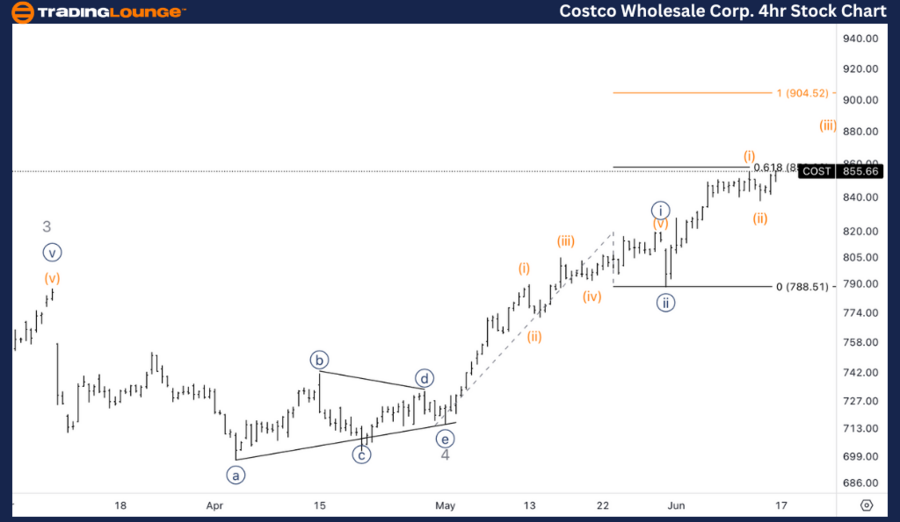
COST Elliott Wave Analysis Trading Lounge 4Hr Chart,
Costco Wholesale Corp., (COST) 4Hr Chart.
COST Elliott Wave technical analysis
Function: Trend.
Mode: Impulsive.
Structure: Motive.
Position: Wave (iii) of {iii}.
Direction: Wave (iii).
Details: Looking for upside into wave (iii), knowing we could switch to a more conservative count where current wave (i) and (ii) is wave {iii} and {iv}. Equality of {iii} vs. {i} stands at 900$.
Welcome to our latest Elliott Wave analysis for Costco Wholesale Corp. (COST). This analysis provides an in-depth look at COST's price movements using the Elliott Wave Theory, helping traders identify potential opportunities based on current trends and market structure. We will cover insights from both the daily and 4-hour charts to offer a comprehensive perspective on COST's market behavior.
COST Elliott Wave technical analysis – Daily chart
In our Elliott Wave analysis of Costco Wholesale Corp. (COST), we observe an impulsive trend characterized by a motive structure. COST is currently positioned in wave 5, specifically in wave {iii} of 5, indicating an upside move. After successfully completing the triangle in wave 4, COST has finished wave {ii} of 5 and is now poised to move higher into wave {iii}. This wave is expected to gain momentum, pushing prices upward as it unfolds. Traders should monitor the progression of wave {iii} closely, as it may present opportunities for long positions, especially if COST continues to show strength above key resistance levels.
COST Elliott Wave technical analysis – Four-hour chart
On the 4-hour chart, COST is also following an impulsive trend within a motive structure, specifically in wave (iii) of {iii}. The analysis suggests an upside continuation into wave (iii), with an awareness that current wave (i) and (ii) might be a more conservative count as wave {iii} and {iv}. This suggests that if the market confirms this alternate view, COST could target equality of wave {iii} vs. wave {i} at $900. Traders should be prepared for potential adjustments in the wave count and watch for consolidation or corrective patterns that might precede further upward movements.
Technical analyst: Alessio Barretta.
COST Elliott Wave technical analysis [Video]
Author

Peter Mathers
TradingLounge
Peter Mathers started actively trading in 1982. He began his career at Hoei and Shoin, a Japanese futures trading company.


