Costco Wholesale Corp. (COST) Elliott Wave technical analysis [Video]
![Costco Wholesale Corp. (COST) Elliott Wave technical analysis [Video]](https://editorial.fxstreet.com/images/Markets/Equities/Industries/Hardware/hardware-network-637435380574876640_XtraLarge.jpg)
COST Elliott Wave technical analysis
Function: Trend.
Mode: Impulsive.
Structure: Motive.
Position: Wave 5 of (5).
Direction: Upside in wave 5.
Details: Looking for continuation higher within wave 5 of (5) as the next large level of resistance will be faced at Trading level at 1000$.
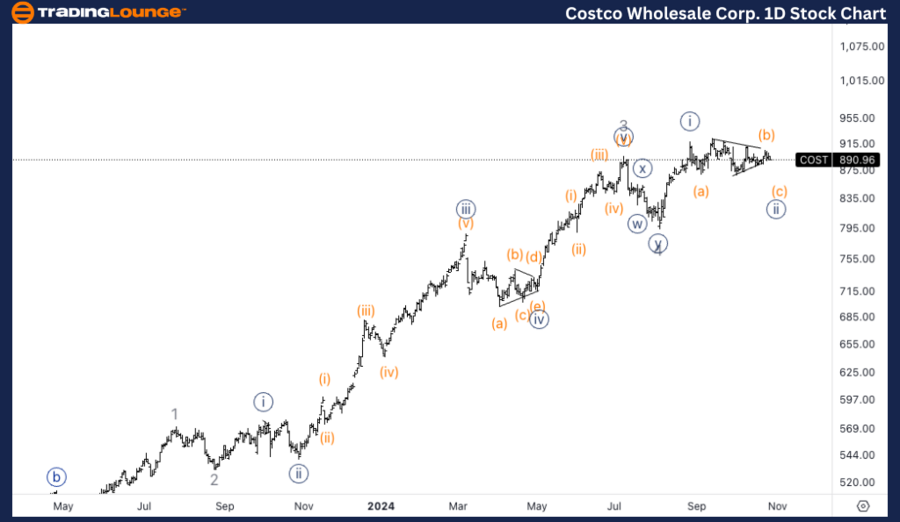
COST Elliott Wave technical analysis – Daily chart
On the daily chart, COST is advancing in wave 5 of (5), indicating the final leg of this bullish sequence. The next significant resistance level is anticipated around the TradingLevel at $1000, which could act as a psychological barrier. The overall trend remains bullish as the price pushes towards this major resistance.
COST Elliott Wave technical analysis
Function: Trend.
Mode: Impulsive.
Structure: Motive.
Position: Wave (c) of {ii}.
Direction: Downside in wave (c).
Details: Looking at what appears to be a triangle in wave (b) of {ii}, therefore we are looking for one more leg lower into wave (c) to complete the overall correction. 850$ could provide support.
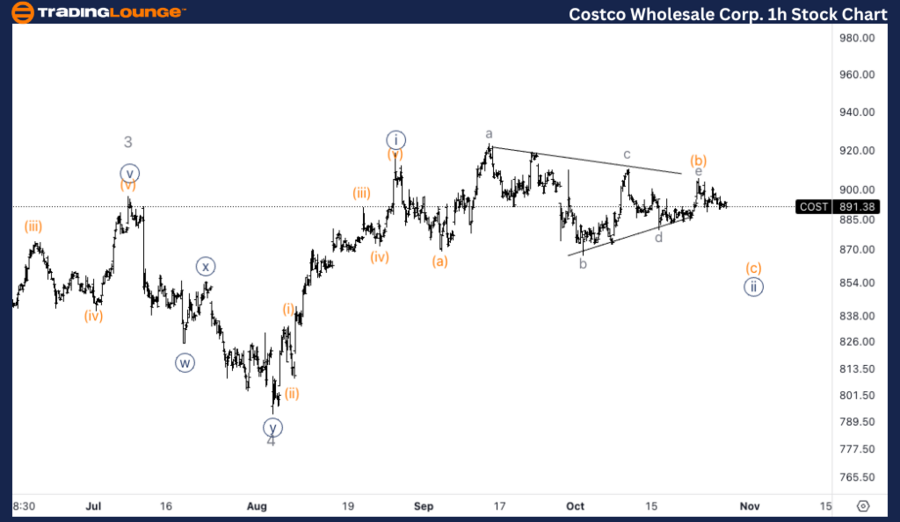
COST Elliott Wave technical analysis – One-hour chart
On the 1-hour chart, COST appears to be in the corrective phase of wave {ii}, specifically in wave (c). The development of a triangle in wave (b) suggests one more leg down in wave (c) to complete the correction. Support around $850could be a critical level to watch, as it might serve as the launching point for the next leg higher.
In this Elliott Wave analysis, we will review the trend structure of Costco Wholesale Corp., (COST) using both the daily and 1-hour charts to assess the current wave position and potential price movements.
Costco Wholesale Corp. (COST) Elliott Wave technical analysis [Video]
Author

Peter Mathers
TradingLounge
Peter Mathers started actively trading in 1982. He began his career at Hoei and Shoin, a Japanese futures trading company.


