Costco Wholesale Corp. (COST) Elliott Wave technical analysis [Video]
![Costco Wholesale Corp. (COST) Elliott Wave technical analysis [Video]](https://editorial.fxstreet.com/images/TechnicalAnalysis/ChartPatterns/PointFigure/stock-market-performance-9668321_XtraLarge.jpg)
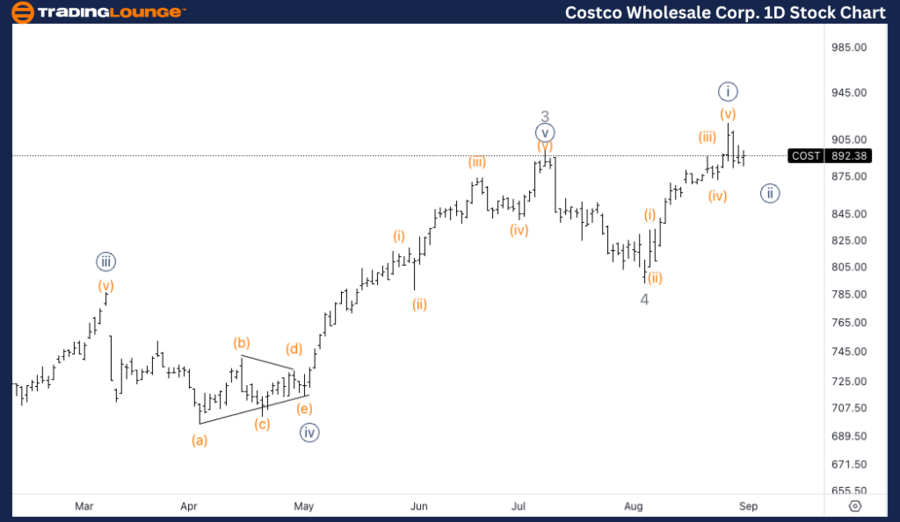
COST Elliott Wave technical analysis
Function: Trend.
Mode: Impulsive.
Structure: Motive.
Position: Wave 5.
Direction: Upside in wave 5.
Details: Looking for continuation higher in wave 5, with the next TradingLevel at 1000$.
COST Elliott Wave technical analysis – Daily chart
COST is in the final stages of its wave 5, indicating that the trend is nearing its culmination. The next significant resistance is expected around the TradingLevel of 1000$, which may act as a target for this wave. Traders should watch for signs of exhaustion as the price approaches this level, as wave 5 typically marks the end of an impulsive trend before a larger corrective phase begins.
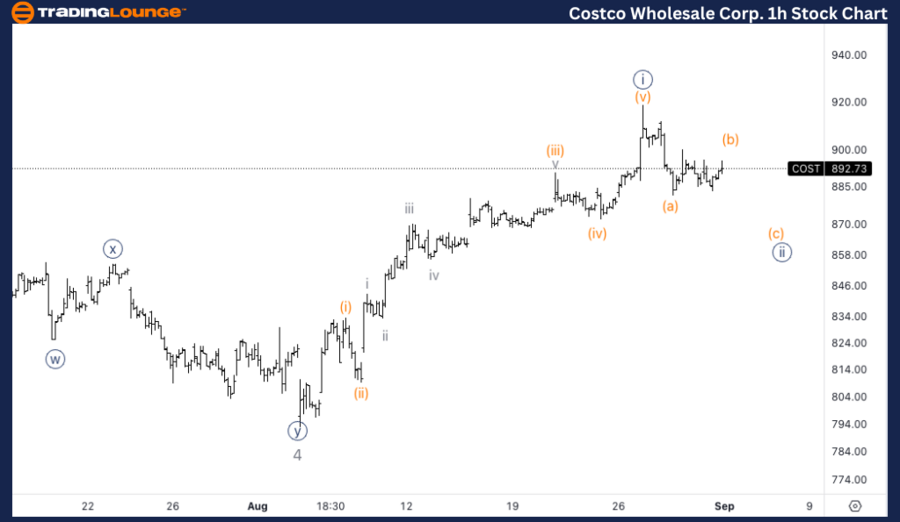
COST Elliott Wave technical analysis
Function: Trend
Mode: Impulsive
Structure: Motive
Position: Wave {ii} of 5.
Direction: Bottom in wave {ii}.
Details: Looking for continuation lower within wave {ii} as we seem to have a potential three wave move in the making and looking for MG2 of 800$ to hold as support.
COST Elliott Wave technical analysis – One-hour chart
The 1-hour chart indicates that COST is currently in wave {ii} of 5, a corrective phase that could see prices moving lower before resuming the uptrend. There is a potential three-wave corrective pattern unfolding, with MG2 (Minor Group 2) around the 800$ level acting as a critical support zone. If this level holds, it could mark the completion of wave {ii} and set the stage for the next impulsive move higher in wave {iii} of 5.
This analysis for Costco Wholesale Corp. (COST), outlines the current Elliott Wave structure and potential price movements on both the daily and 1-hour charts. The focus is on identifying the wave position and key levels that could guide trading decisions.
Costco Wholesale Corp. (COST) Elliott Wave technical analysis [Video]
Author

Peter Mathers
TradingLounge
Peter Mathers started actively trading in 1982. He began his career at Hoei and Shoin, a Japanese futures trading company.


