Costco Wholesale Corp. (COST) Elliott Wave technical analysis [Video]
![Costco Wholesale Corp. (COST) Elliott Wave technical analysis [Video]](https://editorial.fxstreet.com/images/Markets/Equities/Industries/BanksStocks/banks-skyline-637322358568283710_XtraLarge.jpg)
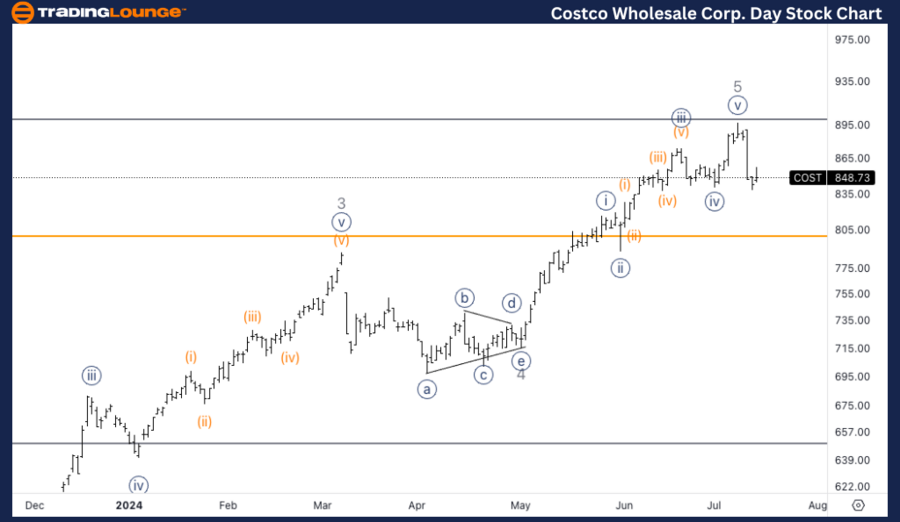
COST Elliott Wave Analysis Trading Lounge Daily Chart,
Costco Wholesale Corp., (COST) Daily Chart
COST Elliott Wave technical analysis
Function: Counter Trend.
Mode: Corrective.
Structure: ZigZag.
Position: Wave A.
Direction: Downside in wave A.
Details: The upside seems completed, looking for a correction in what could have been a top in wave (5) or wave 1 of (5).
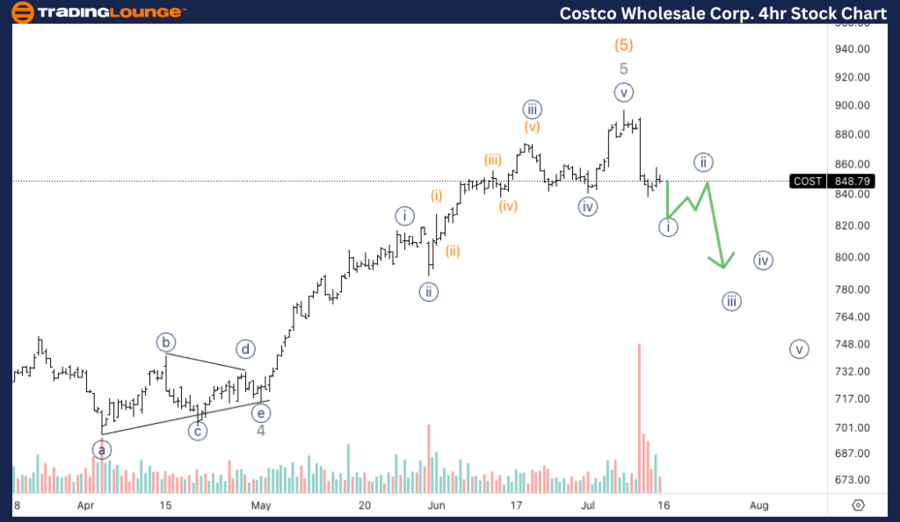
COST Elliott Wave Analysis Trading Lounge 4Hr Chart,
Costco Wholesale Corp., (COST) 4Hr Chart.
COST Elliott Wave technical analysis
Function: Counter Trend.
Mode: Corrective.
Structure: ZigZag.
Position: Wave {i}.
Direction: Bottom in wave {i}.
Details: Looking for a bottom in wave {i} to then pullback and continue lower into at least one more leg lower in what could be either wave {iii} or some sort of wave C.
Welcome to our latest Elliott Wave analysis for Costco Wholesale Corp. (COST). This analysis provides an in-depth look at COST's price movements using the Elliott Wave Theory, helping traders identify potential opportunities based on current trends and market structure. We will cover insights from both the daily and 4-hour charts to offer a comprehensive perspective on COST's market behavior.
COST Elliott Wave technical analysis – Daily chart
The daily chart suggests that the upside move appears to be completed, and we are now looking for a correction. This correction could signify the completion of a top in wave (5) or wave 1 of (5). Traders should be prepared for continued downside pressure as wave A unfolds.
COST Elliott Wave technical analysis – Four-hour Chart
The 4-hour chart indicates that we are looking for a bottom in wave {i} to then see a pullback. After this pullback, we anticipate at least one more leg lower, which could be either wave {iii} or some form of wave C.
Technical analyst: Alessio Barretta
COST Elliott Wave technical analysis [Video]
Author

Peter Mathers
TradingLounge
Peter Mathers started actively trading in 1982. He began his career at Hoei and Shoin, a Japanese futures trading company.


