COST Elliott Wave technical analysis

Function: Trend.

Mode: Impulsive.

Structure: Motive.

Position: Minor 5.

Direction: Upside in Minor 5.  

Details: Trading Level 8 at 800$ will provide resistance, looking for a five wave move to unfold in wave 5.  

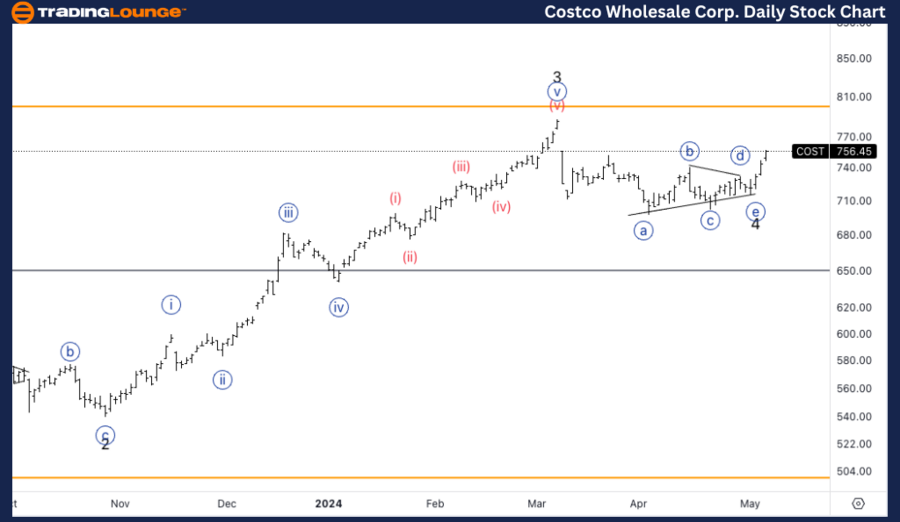
COST Elliott Wave technical analysis – Daily chart

The daily chart of Costco reveals that the stock is currently in an impulsive, motive wave structure, specifically identified as Minor wave 5. This indicates an upward trend with expectations of continuing momentum. The analysis points out that the $800 price level, referred to as TradingLevel8, is expected to act as a significant resistance. In this phase, a five-wave structure within wave 5 is anticipated to unfold, suggesting sustained upward movement.

Chart

COST Elliott Wave technical analysis

Function: Trend.

Mode: Impulsive.

Structure: Motive.

Position: Wave {i} of 5.  

Direction: Pullback in wave {ii}.

Details: Looking for a pullback in wave {ii} to then continue higher and target longs. We seem to be finding support on 720$.

This comprehensive Elliott Wave analysis provides a current and future perspective on Costco Wholesale Corporation (COST), focusing on the potential price movements as indicated by the Elliott Wave theory on the daily and 4-hour charts as of May 7, 2024. Investors and traders can leverage this detailed insight to optimize their market positions.

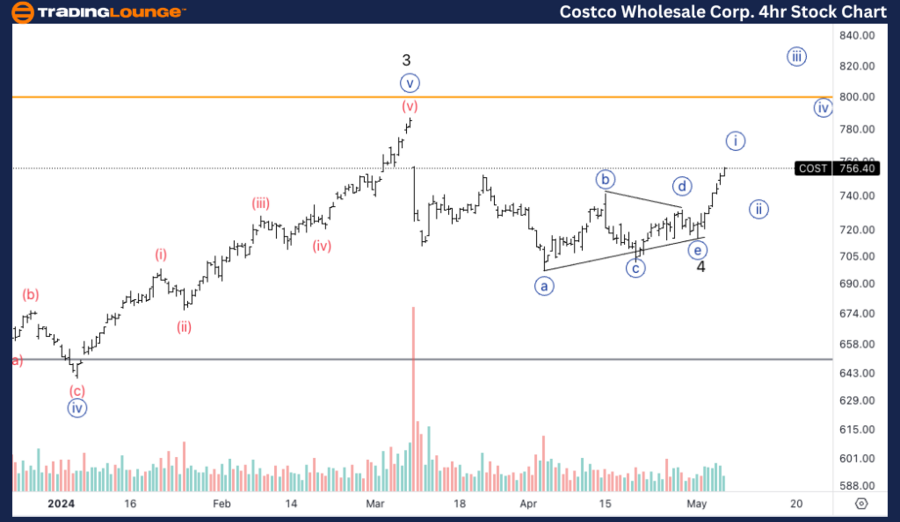
COST Elliott Wave technical analysis – Four-hour chart

Zooming into the 4-hour chart, Costco is currently positioned in Wave {i} of Minor 5, and a pullback in Wave {ii} is expected. This pullback presents a strategic entry point for traders, with the stock finding preliminary support at the $720 level. Following this correction, a continuation higher in Wave {iii} is likely.

Chart

Costco Wholesale Corp.(COST) Elliott Wave technical analysis [Video]

Share: Feed news

As with any investment opportunity there is a risk of making losses on investments that Trading Lounge expresses opinions on.

Historical results are no guarantee of future returns. Some investments are inherently riskier than others. At worst, you could lose your entire investment. TradingLounge™ uses a range of technical analysis tools, software and basic fundamental analysis as well as economic forecasts aimed at minimizing the potential for loss.

The advice we provide through our TradingLounge™ websites and our TradingLounge™ Membership has been prepared without considering your objectives, financial situation or needs. Reliance on such advice, information or data is at your own risk. The decision to trade and the method of trading is for you alone to decide. This information is of a general nature only, so you should, before acting upon any of the information or advice provided by us, consider the appropriateness of the advice considering your own objectives, financial situation or needs. Therefore, you should consult your financial advisor or accountant to determine whether trading in securities and derivatives products is appropriate for you considering your financial circumstances.

Recommended content


Recommended content

Editors’ Picks

AUD/USD consolidates near 19-month peak as traders await US PCE Price Index

AUD/USD consolidates near 19-month peak as traders await US PCE Price Index

AUD/USD oscillates in a range below the 0.6900 mark, as traders opt to move to the sidelines ahead of the US PCE Price Index. In the meantime, the RBA's hawkish stance, the optimism led by additional monetary stimulus from China, the prevalent risk-on mood, and a bearish USD continue to act as a tailwind for the pair.

AUD/USD News
USD/JPY holds above 145.00 after the Tokyo CPI inflation data

USD/JPY holds above 145.00 after the Tokyo CPI inflation data

The USD/JPY pair attracts some buyers to near 145.20 on Friday during the early Asian session. The pair gains ground near three-week highs after the Tokyo Consumer Price Index. The attention will shift to the US Personal Consumption Expenditures Price Index for August, which is due later on Friday. 

USD/JPY News
Gold price holds steady near record peak; looks to US PCE data from fresh impetus

Gold price holds steady near record peak; looks to US PCE data from fresh impetus

Gold price consolidates below the all-time high set on Thursday amid overbought conditions on the daily chart and the risk-on mood, though dovish Fed expectations continue to act as a tailwind. Bulls, meanwhile, prefer to wait for the release of the US PCE Price Index before placing fresh bets. 

Gold News
Ethereum could retest $2,707 resistance following increasing ETF inflows and uptrend in funding rates

Ethereum could retest $2,707 resistance following increasing ETF inflows and uptrend in funding rates

Ethereum traded around $2,640 on Thursday, up more than 2% following increased bullish bias among investors, as evidenced by ETH ETF net inflows and an uptrend in funding rates. However, investors may be wary of a potential correction from ETH's rising exchange reserve.

Read more
RBA widely expected to keep key interest rate unchanged amid persisting price pressures

RBA widely expected to keep key interest rate unchanged amid persisting price pressures

The Reserve Bank of Australia is likely to continue bucking the trend adopted by major central banks of the dovish policy pivot, opting to maintain the policy for the seventh consecutive meeting on Tuesday.

Read more
Five best Forex brokers in 2024

Five best Forex brokers in 2024

VERIFIED Choosing the best Forex broker in 2024 requires careful consideration of certain essential factors. With the wide array of options available, it is crucial to find a broker that aligns with your trading style, experience level, and financial goals. 

Read More

Forex MAJORS

Cryptocurrencies

Signatures