COST Elliott Wave technical analysis [Video]
![COST Elliott Wave technical analysis [Video]](https://editorial.fxstreet.com/images/Markets/Equities/DowJones/bloomberg-app-on-iphone-4-with-market-data-17118657_XtraLarge.jpg)
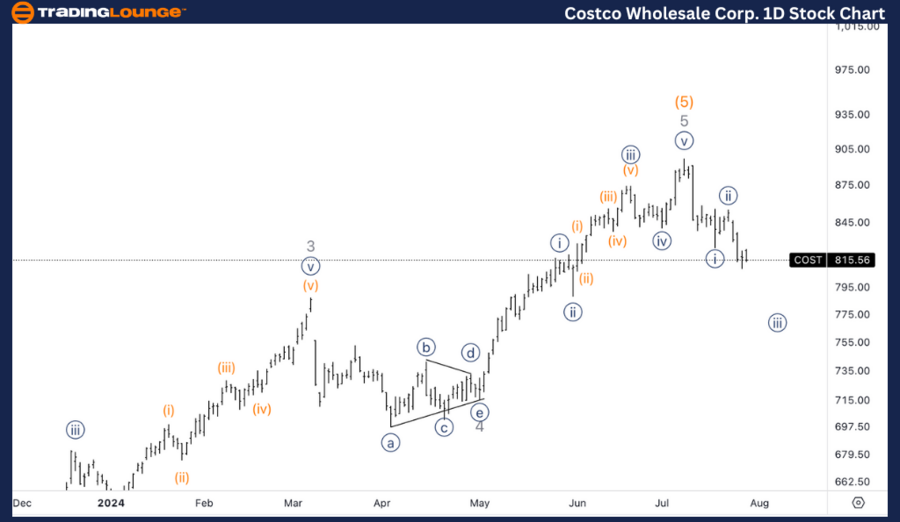
COST Elliott Wave Analysis Trading Lounge Daily Chart,
Costco Wholesale Corp., (COST) Daily Chart
COST Elliott Wave technical analysis
Function: Counter Trend.
Mode: Corrective.
Strucute: ZigZag.
Position: Wave A.
Direction: Downside into wave A.
Details: We are looking at the end of a significant bull run in COST. Anticipating more downside to come in the upcoming weeks, to at least retrace near the area of Minor wave 4.
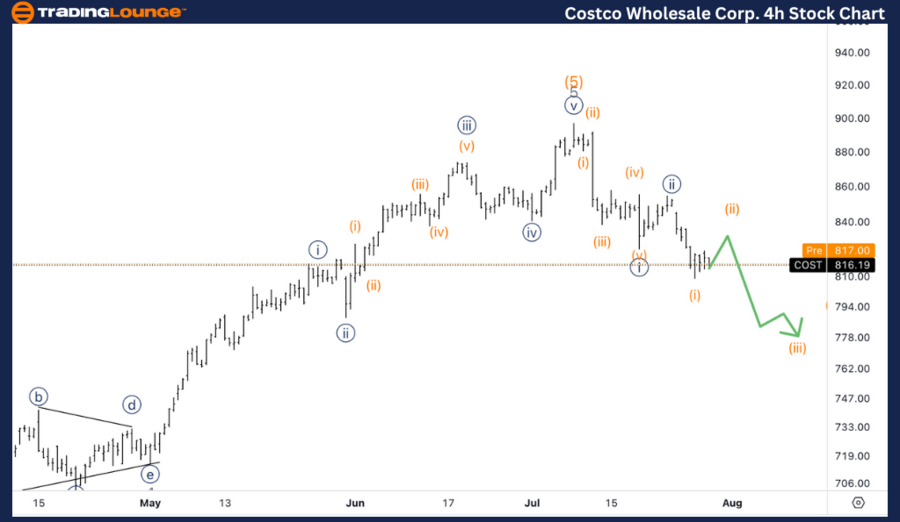
COST Elliott Wave Analysis Trading Lounge 4H Chart,
Costco Wholesale Corp., (COST) 4H Chart.
COST Elliott Wave technical analysis
Function: Counter Trend.
Mode: Corrective.
Structure: ZigZag.
Position: Wave {iii} of A.
Direction: Downside in wave {iii}.
Details: Looking for continuation lower into wave {iii} as we’ve had what appears to be a clear five wave move into wave {i} and we are now looking for continuation lower. If we were to turn into a three wave move, I’d still expect further downside to come.
Welcome to our latest Elliott Wave analysis for Costco Wholesale Corp. (COST) as of July 30, 2024. This analysis provides insights into COST's price movements using the Elliott Wave Theory, highlighting potential trading opportunities based on current trends and market structure. We will examine both the daily and 4-hour charts to provide a detailed view of COST's market dynamics.
COST Elliott Wave technical analysis – Daily chart
The daily chart indicates that COST may have reached the end of a significant bull run. We are anticipating more downside movement in the upcoming weeks, likely retracing to the area of the previous Minor wave 4. This suggests that the correction is still unfolding and we could see further declines before a potential reversal.
COST Elliott Wave technical analysis – Four-hour chart
The 4-hour chart shows a clear five-wave move into wave {i}, followed by a correction and now a continuation lower into wave {iii}. This suggests that the current move is part of a larger corrective pattern. Even if we see a short-term three-wave correction, the overall expectation remains for further downside.
Technical analyst: Alessio Barretta.
COST Elliott Wave technical analysis [Video]
Author

Peter Mathers
TradingLounge
Peter Mathers started actively trading in 1982. He began his career at Hoei and Shoin, a Japanese futures trading company.


