- Copper stands on slippery ground, drops the most since June 17.
- Downbeat MACD, DMA break favor sellers, 61.8% Fibonacci retracement test immediate downside.
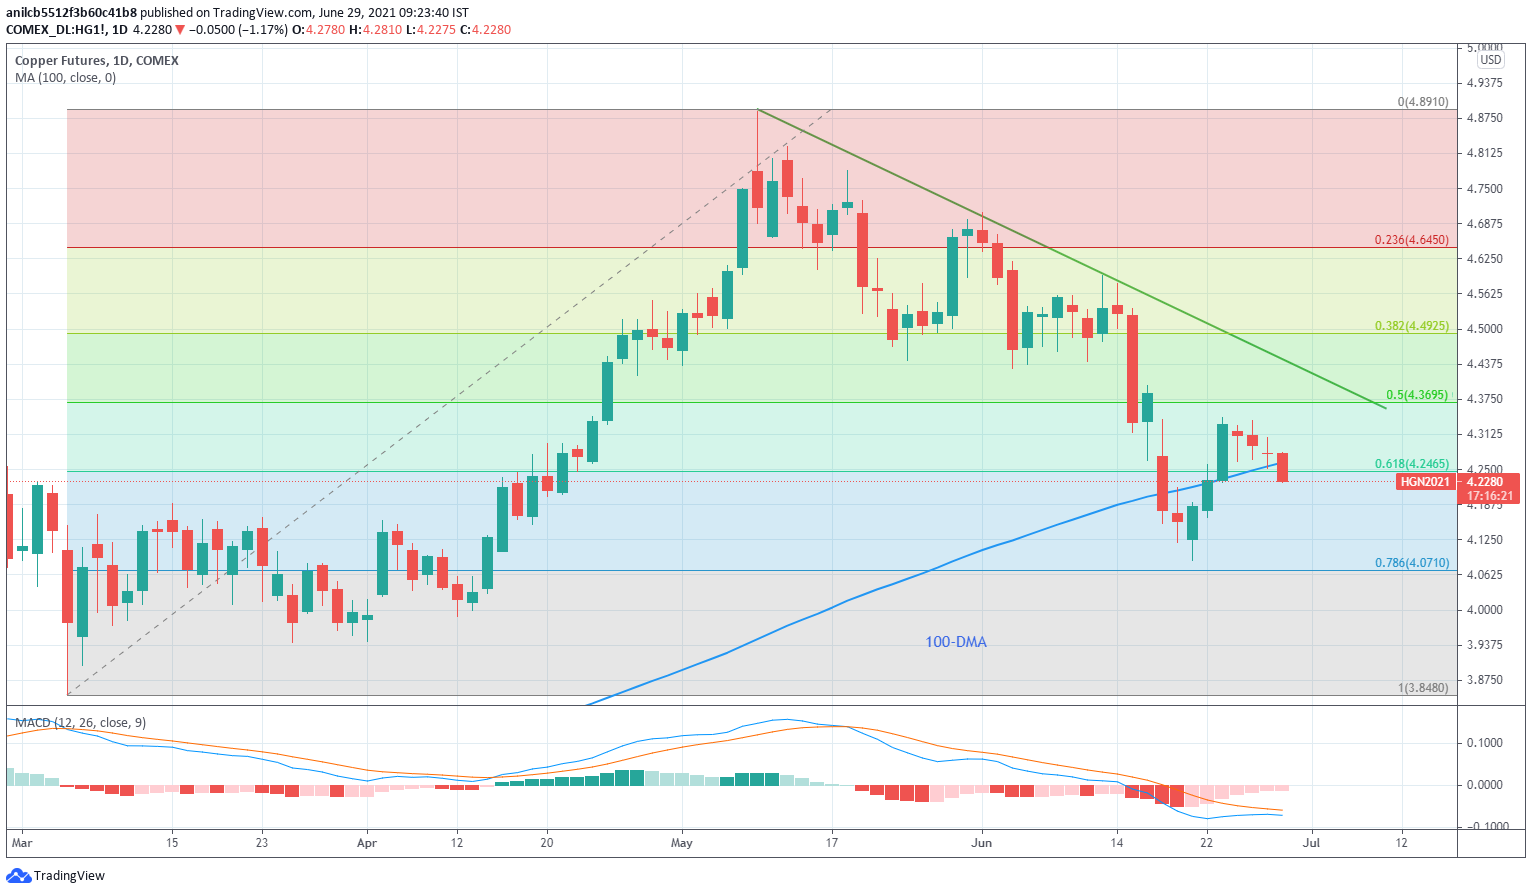
Copper remains on the back foot for the fourth consecutive day, down 1.02% intraday around $4.2350, amid early Tuesday. In doing so, the red metal again breaks the 100-day SMA (DMA), reversing the previous week’s breakout.
Given the downbeat MACD conditions backing the commodity sellers, copper’s decline to the month low near $4.0880 can’t be ruled out. However, a daily closing below 61.8% Fibonacci retracement of the March-May upside, surrounding $4.2400, becomes necessary.
Also acting as the downside filter is the 78.6% Fibonacci retracement level of $4.0640 and the $4.0000 threshold, not to forget March’s low of $3.9420.
Meanwhile, recovery moves not only need a daily closing beyond the 100-SMA level of $4.2625 but also require a sustained run-up beyond the latest swing high of $4.3425 to keep recall the bulls.
Following that, a 50% Fibonacci retracement level of $4.3650 and multiple lows marked since late April around $4.4300 could entertain copper bulls.
Price of copper: Daily chart
Trend: Bearish
Information on these pages contains forward-looking statements that involve risks and uncertainties. Markets and instruments profiled on this page are for informational purposes only and should not in any way come across as a recommendation to buy or sell in these assets. You should do your own thorough research before making any investment decisions. FXStreet does not in any way guarantee that this information is free from mistakes, errors, or material misstatements. It also does not guarantee that this information is of a timely nature. Investing in Open Markets involves a great deal of risk, including the loss of all or a portion of your investment, as well as emotional distress. All risks, losses and costs associated with investing, including total loss of principal, are your responsibility. The views and opinions expressed in this article are those of the authors and do not necessarily reflect the official policy or position of FXStreet nor its advertisers. The author will not be held responsible for information that is found at the end of links posted on this page.
If not otherwise explicitly mentioned in the body of the article, at the time of writing, the author has no position in any stock mentioned in this article and no business relationship with any company mentioned. The author has not received compensation for writing this article, other than from FXStreet.
FXStreet and the author do not provide personalized recommendations. The author makes no representations as to the accuracy, completeness, or suitability of this information. FXStreet and the author will not be liable for any errors, omissions or any losses, injuries or damages arising from this information and its display or use. Errors and omissions excepted.
The author and FXStreet are not registered investment advisors and nothing in this article is intended to be investment advice.
Recommended content
Editors’ Picks

EUR/USD gathers traction toward 1.0450 amid US Dollar weakness
EUR/USD regains upside traction and nears 1.0450 in the European trading hours on Thursday. Broad US Dollar weakness supports the pair. However, tariff threats from US President Donald Trump and geopolitical tension might cap its upside. US data and Fedspeak remains in focus.

Gold rallies with yields taking a step back
Gold is printing another fresh all-time high at around $2,955. US President Donald Trump took markets by surprise when he mentioned a trade deal with China could be done. If US yields drop off further, expect to see more all-time highs in Gold this week.

GBP/USD holds ground above 1.2600, awaits US data
GBP/USD holds ground above 1.2600 in the European session on Thursday. The pair is helped by a sustained US Dollar weakness but broad risk-off mood due to renewed tariff threats from US President Donald Trump could limit the risk sensitive Pound Sterling. US data is next in focus.

Stellar Price Forecast: XLM’s Total Value Locked reaches over $62 million
Stellar (XLM) price trades inside a channel pattern; a breakout indicates bullish momentum. Crypto intelligence tracker DefiLlama data shows that XLM’s TVL reaches $62 million while the technical outlook projects a target of $0.74.

Money market outlook 2025: Trends and dynamics in the Eurozone, US, and UK
We delve into the world of money market funds. Distinct dynamics are at play in the US, eurozone, and UK. In the US, repo rates are more attractive, and bills are expected to appreciate. It's also worth noting that the Fed might cut rates more than anticipated, similar to the UK. In the eurozone, unsecured rates remain elevated.

The Best brokers to trade EUR/USD
SPONSORED Discover the top brokers for trading EUR/USD in 2025. Our list features brokers with competitive spreads, fast execution, and powerful platforms. Whether you're a beginner or an expert, find the right partner to navigate the dynamic Forex market.
