Commonwealth Bank of Australia Elliott Wave analysis and technical forecast [Video]
![Commonwealth Bank of Australia Elliott Wave analysis and technical forecast [Video]](https://editorial.fxstreet.com/images/i/bullish-chart_XtraLarge.png)
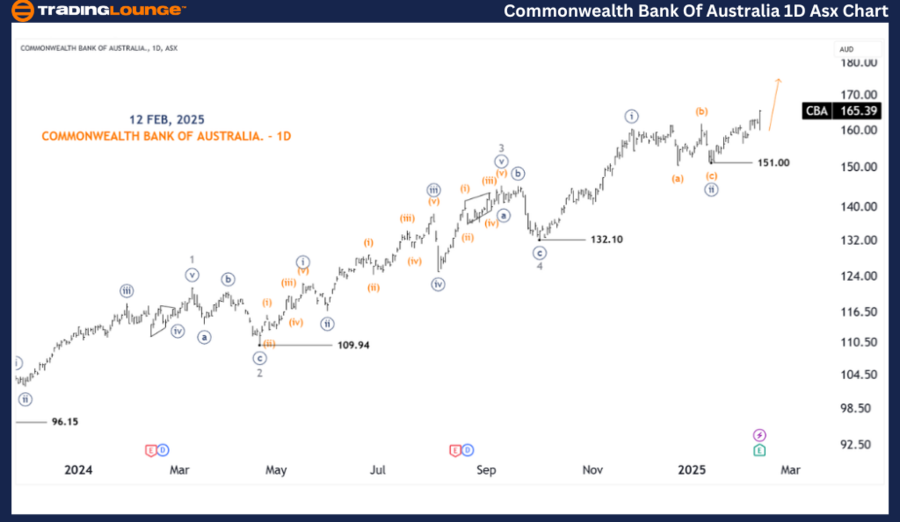
Our Elliott Wave analysis today presents an updated perspective on the Australian Stock Exchange (ASX) with COMMONWEALTH BANK OF AUSTRALIA (CBA).
We identify upside potential and anticipate a bullish trend in ASX:CBA with Wave Three in progress. This analysis highlights target zones, key levels, and the essential price points to determine when this view remains valid or is no longer applicable.
ASX: CBA Elliott Wave technical analysis (one-day chart - Semilog scale)
Function:
-
Major trend: Minor degree (grey)
-
Mode: Motive
-
Structure: Impulse
-
Position: Wave ((iii)) - navy of Wave 5 - grey
Details:
-
Wave 5 (grey) is currently extending, and we are counting its subwaves ((i)), ((ii)) (navy).
-
Since the low at 151.00, wave ((iii)) (navy) is gaining momentum, reinforcing our expectation of a bullish market in the short term.
-
Next target: 200.00
-
Invalidation level: 151.00
ASX: CBA Elliott Wave technical analysis (four-hour chart)
Function:
-
Major trend: Minor degree (grey).
-
Mode: Motive.
-
Structure: Impulse.
-
Position: Wave (iii) - orange of Wave ((iii)) - navy of Wave 5 - grey.
Details:
-
Taking a closer look at wave ((iii)) (navy), we observe smaller degree subwaves (i), (ii) (orange), which have concluded.
-
Now, wave (iii) (orange) of wave ((iii)) (navy) is gaining strength, pushing toward higher price targets.
-
Next Target Levels: 173.98 and potentially 180.00.
-
Key invalidation level: 156.17.

Conclusion
Our Elliott Wave analysis and forecast for ASX: COMMONWEALTH BANK OF AUSTRALIA (CBA) aim to provide traders with a clear understanding of market trends and actionable insights to optimize trading strategies.
By specifying crucial price levels that confirm or invalidate our wave count, we enhance the reliability of our perspective. Our objective is to equip readers with the most precise and professional view of ASX market trends.
Commonwealth Bank of Australia Elliott Wave analysis and technical forecast [Video]
Author

Peter Mathers
TradingLounge
Peter Mathers started actively trading in 1982. He began his career at Hoei and Shoin, a Japanese futures trading company.


