Coiling for a breakout – Up or down? [Video]
![Coiling for a breakout – Up or down? [Video]](https://editorial.fxstreet.com/images/Markets/Equities/Industries/Software/software-code-637435356353853480_XtraLarge.jpg)
Watch the video extracted from the WLGC session before the market open on 16 Jan 2024 below to find out the following:
-
How the potential supply absorption scenario could unfold and affect the S&P 500.
-
The spring entry setup for short-term swing trading.
-
Why the current rally might not be sustainable.
-
The price target of the S&P 500 should the key support levels fall through.
-
and a lot more...
The bullish vs. bearish setup is 276 to 178 from the screenshot of my stock screener below.
Although this is still a healthy and positive market environment, the bullish setup has decreased significantly compared to last week.
This is consistent with the deteriorating short-term market breadth, suggesting only a handful of the heavy-weight stocks are supporting the S&P 500.
Wyckoff method stock screener
A localised topping formation could be in progress as discussed in the tweet earlier below:
"This is very bullish momentum $SPX $ES #SP500 and it will take a process like a localized topping formation, similar to the localized stopping process as shown in the video in order to stop the whole trend and then come to a pullback." pic.twitter.com/pYDk4xPdEp
— Ming Jong Tey (@MingJong) January 3, 2024
8 “low-hanging fruits” (CR, ANF, etc…) trade entries setup + 15 others (CELH etc…) plus 8 “wait and hold” candidates are discussed in the video (33:28) accessed by subscribing members below.
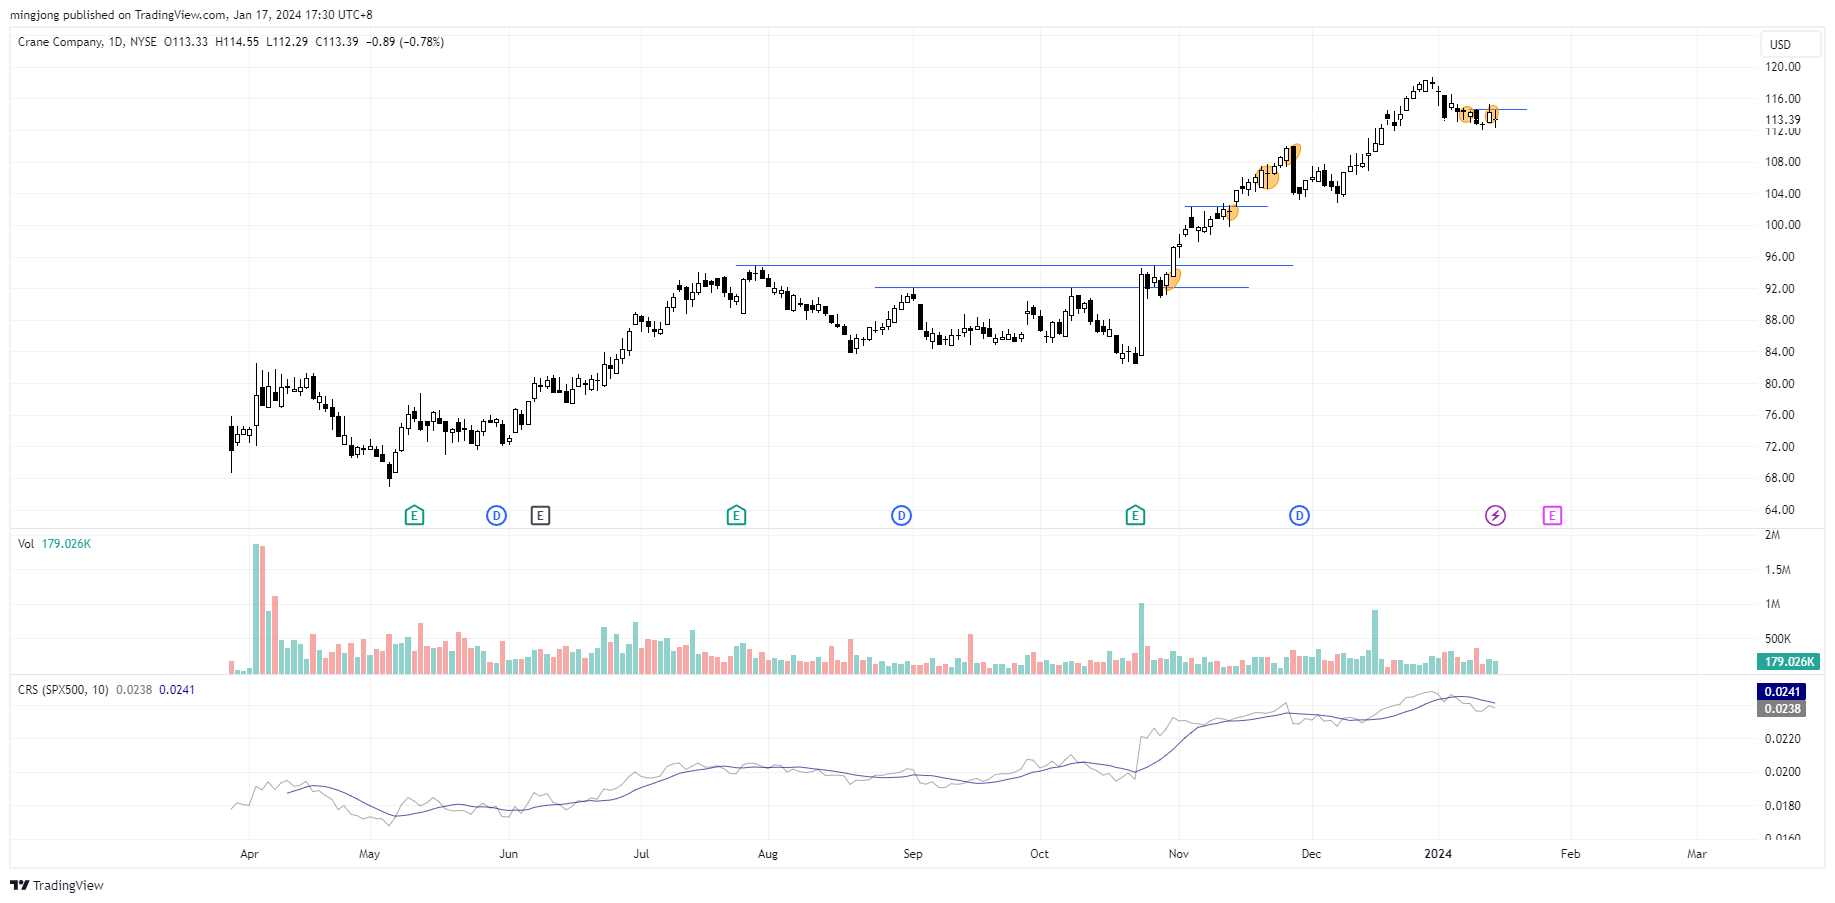
CR
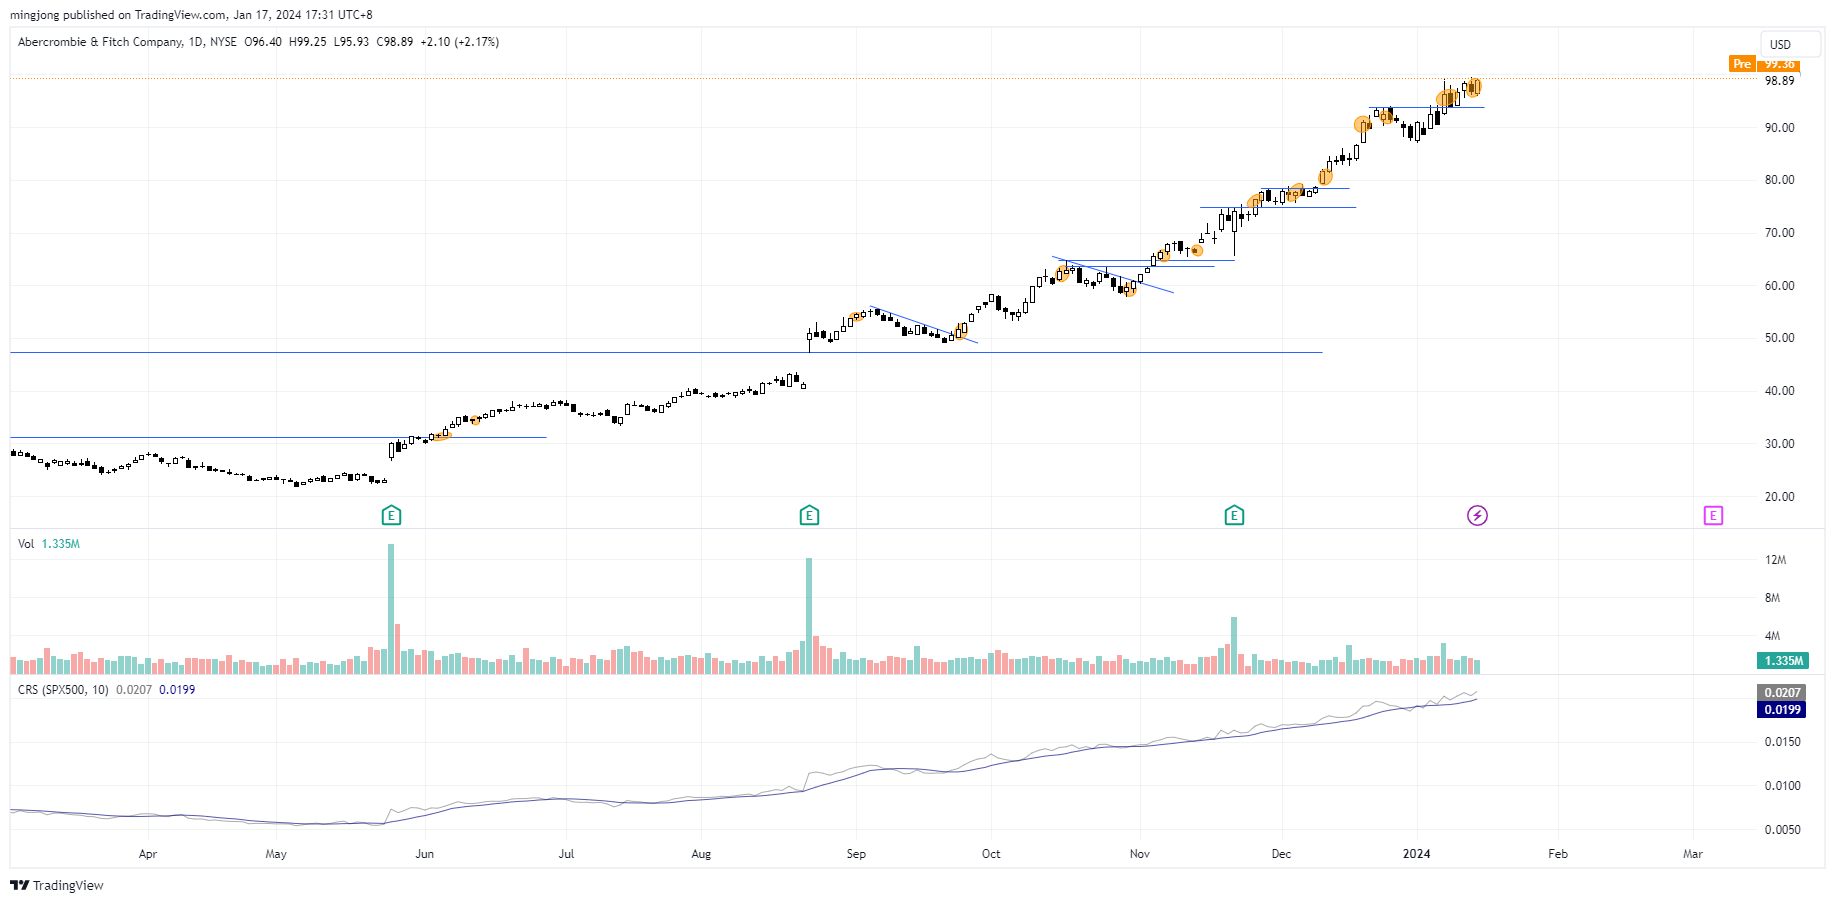
ANF
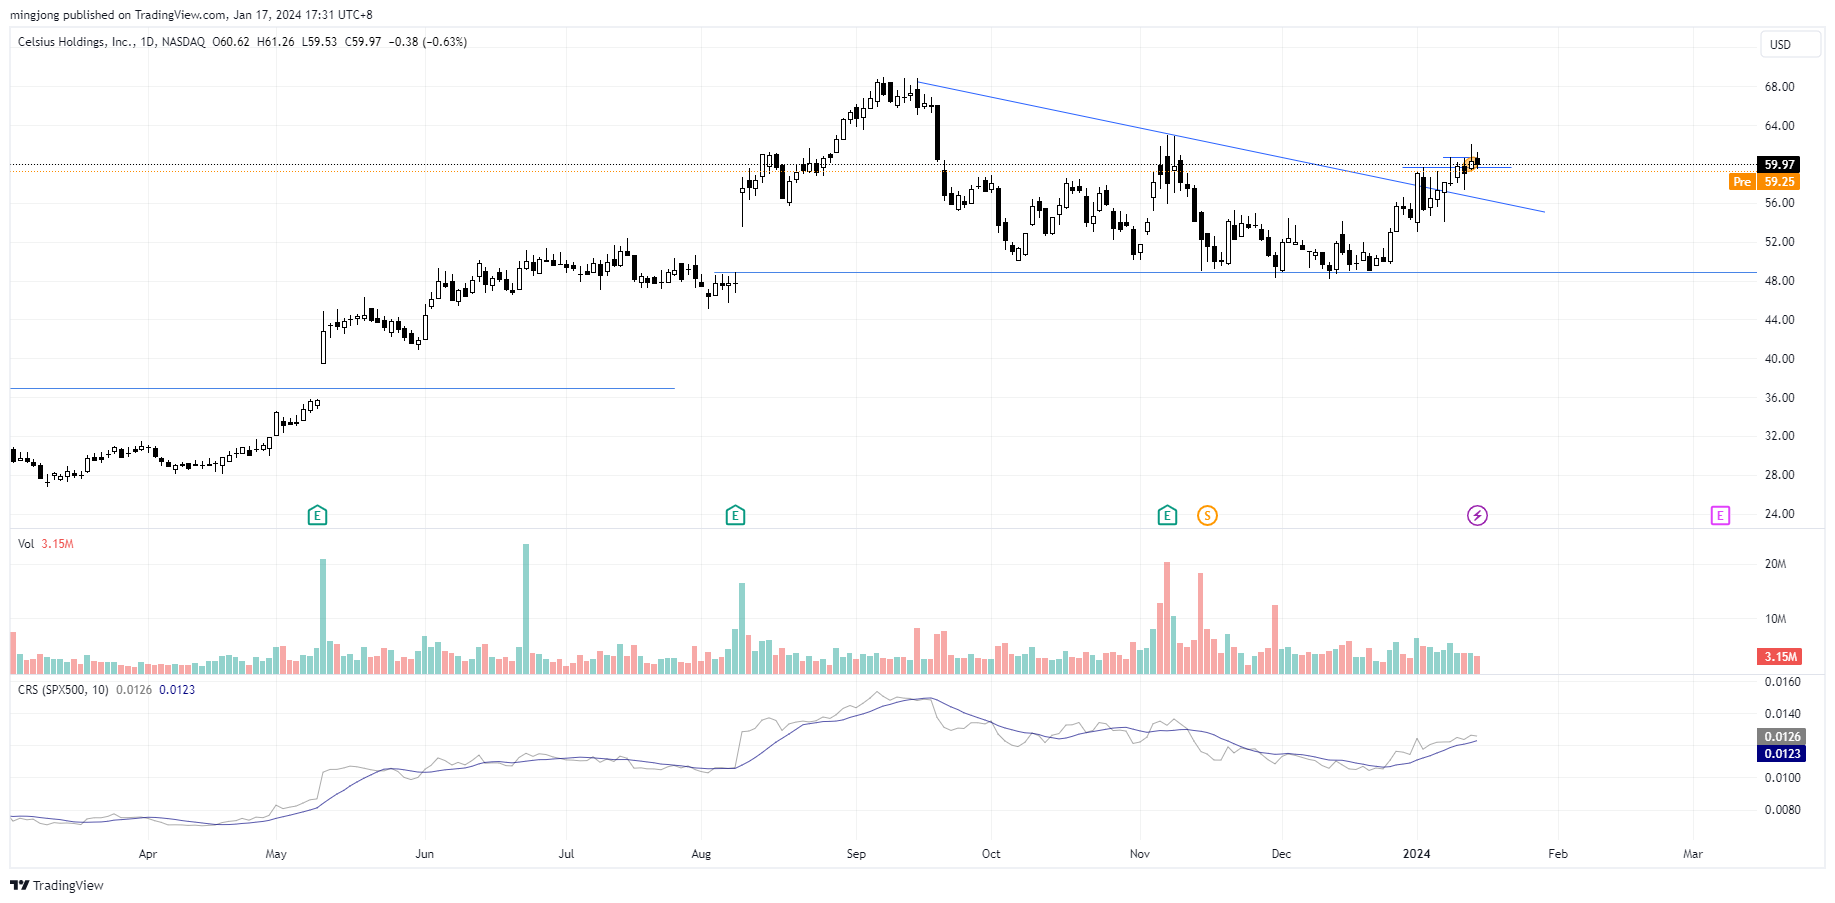
CELH
Author

Ming Jong Tey
Independent Analyst
Ming Jong Tey has been trading since 2008. He started his learning journey from technical analysis (indicators, Fibonacci, etc...) to value investing. Throughout his journey, he develops an interest in price action with chart pattern trading.


