Introduction
VolatilityMarkets Trend Following Trade.
According to AQR the quantitative hedge fund and Yale University, over the past 100 years markets moved in trends. Trends are successive upwards and downwards movements in price that occur at a greater frequency than would be predicted by randomness alone. The following trade idea is a trend following trade idea which takes the assumption that the market will continue moving in the way it has over the previous sessions. Trend Trading, however is different than scalping due to the time horizon of the trade as trend following trades will take a week while scalping is done on a daily or intraday basis.
Market summary
Price
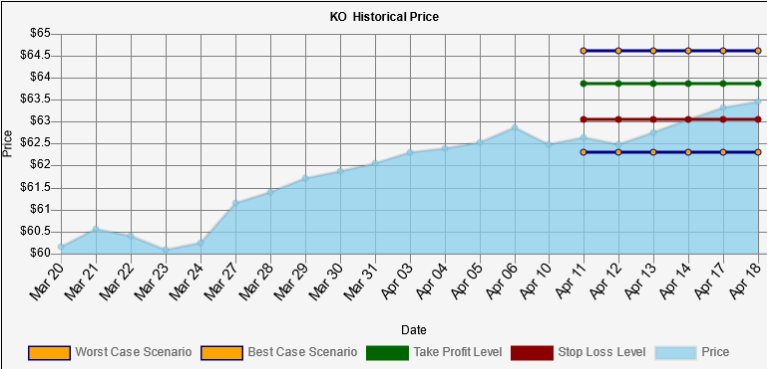
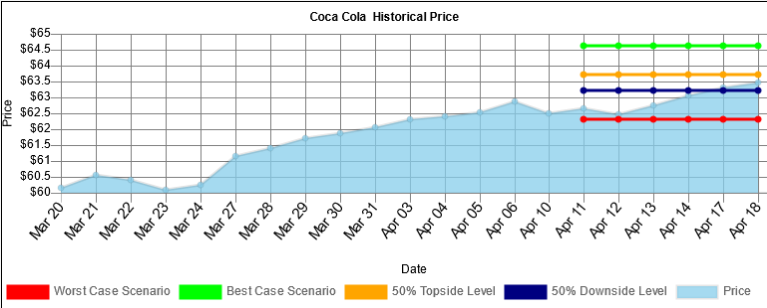
Coca Cola last price was $ 63.46.
Trend analysis
In the short term Coca Cola has been decelerating higher. In the long term Coca Cola has been decelerating higher.
Value analysis
Over the past 20 days, the Coca Cola price increased 16 days and decreased 4 days.
For every up day, there were 0.25 down days.
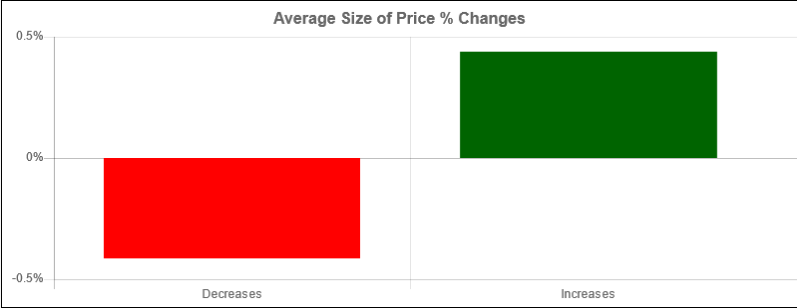
The average return on days where the price increased is 0.4388%.
The average return on days where the price decreased is -0.4135%.
Performance
Over the past 20 Days, the price has increased by 5.49% percent.
Over the past 20 days, the average return per day has been 0.2745% percent.
Trade Idea
Taking into account the long term trend decelerating higher, we propose a long trade idea with time horizon..
Trend trade idea
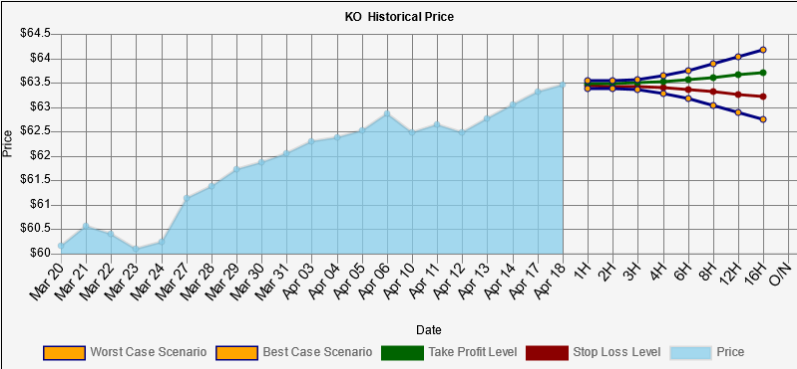
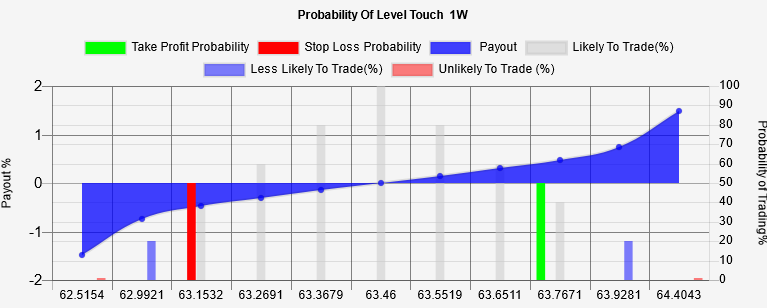
Buy $ 258,301 USD of Coca Cola, take profit at $ 63.7053 level for a $ 1,000 USD gain, stop out at $ 63.0634 for a $ 1,000 USD loss through a one Week time horizon.
Intraday predictions
Coca Cola trend analysis
Coca Cola last price was $ 63.46. The long term trend decelerating higher is stronger than the short term trend decelerating higher. This trade goes long when the price was moving higher but decelerating over the past 20 days.
Coca Cola value analysis
Over the past 20 days, the Coca Cola price increased 16 days and decreased 4 days. For every up day, there were 0.25 down days. The average return on days where the price increased is 0.4388% The average return on days where the price decreased is -0.4135% Over the past 20 Days, the price has increased by 5.49% percent. Over the past 20 days, the average return per day has been 0.2745% percent.
Coca Cola worst/best case scenario analysis
Within 1 week, our worst case scenario where we are 95% certain that this level won't trade for Coca Cola, is $ 62.299, and the best case scenario overnight is $ 64.621. levels outside of this range are unlikely, but still possible, to trade. We are 50% confident that $ 63.0634 could trade and that $ 63.7053 could trade. These levels are within statistical probability.
Expected range
Within 1 week, our worst case scenario where we are 95% certain that this level won't trade for KO, is $ 62.299 , and the best case scenario overnight is $ 64.621 . levels outside of this range are unlikely, but still possible, to trade.
We are 50% confident that $ 63.0634 could trade and that $ 63.7053 could trade. These levels are within statistical probability.
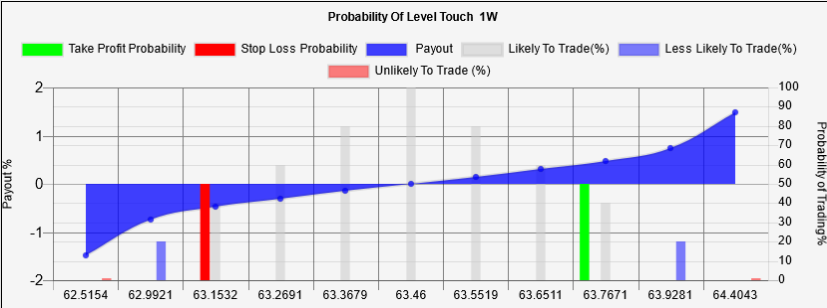
Probability Vs Payout Chart:
This graph contrasts the percentage payout of holding a position vs the probability that the payout occurs. The red and green columns represent the probability of stopping out and taking profit and their associated payouts.
Key Takeaways:
-
Price today $ 63.46.
-
Over the past 20 days, the Coca Cola price increased 16 days and decreased 4 Days.
-
For every up day, there were 0.25 down days.
-
The average return on days where the price increased is 0.4388%.
-
The average return on days where the price decreased is -0.4135%.
-
Over the past 20 Days, the price has increased by 5.49% percent.
-
Over the past 20 days, the average return per day has been 0.2745% percent.
-
Over the past 20 days, The price has on average been decelerating: $ -0.0142 per day higher.
-
Over the last session, the price increased by $ 0.14.
-
Over the last session, the price increased by 0.2206 %.
-
Over the last session, the price decelerated by $ -0.13 .
Volatility Markets provides trend following trade ideas for momentum traders. The Volatility Markets Newswire measures the direction and acceleration of a security and then structures a trade idea to capitalize on the trend. While trends have been shown to exist in markets over the past 100 years, they are no guarantee of future asset prices. You should take these ideas lightly and at your own risk.
Recommended content
Editors’ Picks
EUR/USD struggles to hold above 1.0400 as mood sours
EUR/USD stays on the back foot and trades near 1.0400 following the earlier recovery attempt. The holiday mood kicked in, keeping action limited across the FX board, while a cautious risk mood helped the US Dollar hold its ground and forced the pair to stretch lower.
GBP/USD approaches 1.2500 on renewed USD strength
GBP/USD loses its traction and trades near 1.2500 in the second half of the day on Monday. The US Dollar (USD) benefits from safe-haven flows and weighs on the pair as trading conditions remain thin heading into the Christmas holiday.

Gold hovers around $2,610 in quiet pre-holiday trading
Gold struggles to build on Friday's gains and trades modestly lower on the day near $2,620. The benchmark 10-year US Treasury bond yield edges slightly higher above 4.5%, making it difficult for XAU/USD to gather bullish momentum.

Crypto Today: BTC hits new Trump-era low as Chainlink, HBAR and AAVE lead market recovery
The global cryptocurrency market cap shrank by $500 billion after the Federal Reserve's hawkish statements on December 17. Amid the market crash, Bitcoin price declined 7.2% last week, recording its first weekly timeframe loss since Donald Trump’s re-election.
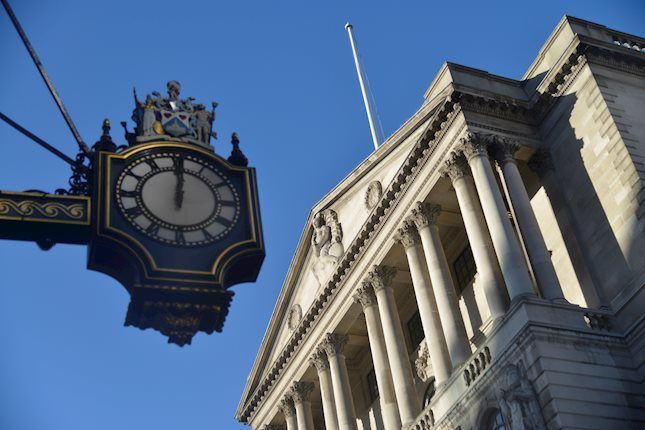
Bank of England stays on hold, but a dovish front is building
Bank of England rates were maintained at 4.75% today, in line with expectations. However, the 6-3 vote split sent a moderately dovish signal to markets, prompting some dovish repricing and a weaker pound. We remain more dovish than market pricing for 2025.

Best Forex Brokers with Low Spreads
VERIFIED Low spreads are crucial for reducing trading costs. Explore top Forex brokers offering competitive spreads and high leverage. Compare options for EUR/USD, GBP/USD, USD/JPY, and Gold.

