COALINDIA Elliott Wave technical analysis [Video]
![COALINDIA Elliott Wave technical analysis [Video]](https://editorial.fxstreet.com/images/Markets/Equities/Nasdaq/yellow-taxi-in-times-square-of-new-york-city-manhattan-29728130_XtraLarge.jpg)
COAL INDIA LTD – COALINDIA (One-hour chart) Elliott Wave technical analysis
Function: Counter Trend Lower (Minor degree, Grey).
Mode: Corrective.
Structure: Potential impulse within larger degree correction.
Position: Lower degree Wave ((iv)). Not labelled on daily chart.
Details: As discussed earlier, the alternative count might have turned the preferred one with potential top in place around 550, termination of Intermediate Wave (5) Orange. If correct, near term target could be 460.
Invalidation point: 550.
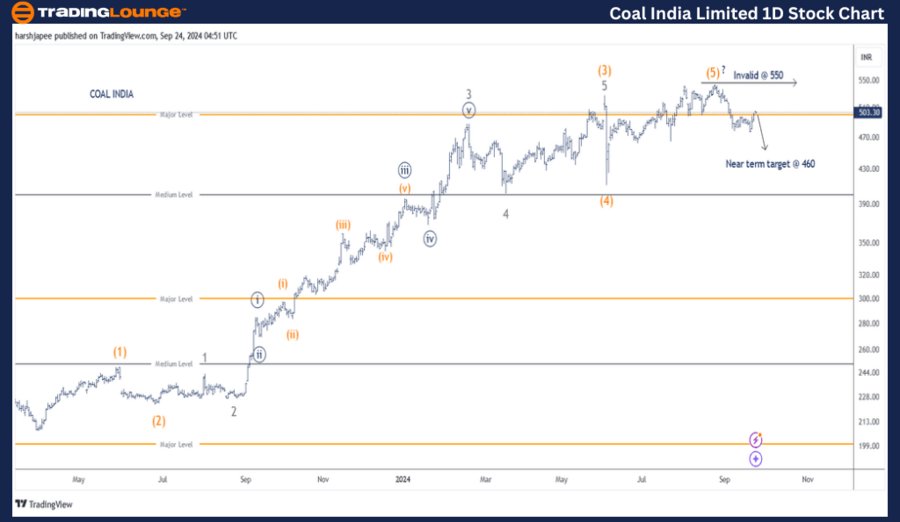
COAL INDIA Daily Chart Technical Analysis and potential Elliott Wave Counts:
COAL INDIA daily chart might be changing its overall trend with potential top in place at 550, Intermediate Wave (5) Orange marked on the chart today. Prices could be heading towards 460 levels near term to complete the impulse at Minor Degree.
COAL INDIA hit 206 low in March 2023 and since then the stock has progressed higher sub dividing into Intermediate Waves (1) through (5) Orange. The high registered around 545-550 range could be Wave (5) Orange with prices reversing sharply lower thereafter.
If the above is correct, bears could continue to remain in control holding prices below 550 and drag towards 460 mark before giving up. Only a break above 550 ideally changes the structure for now.
COAL INDIA LTD – COALINDIA (Four-hour chart) Elliott Wave technical analysis
Function: Counter Trend Lower (Minor degree, Grey).
Mode: Corrective.
Structure: Potential impulse within larger degree correction.
Position: Lower degree Wave ((iv)). Not labelled on daily chart.
Details: As discussed earlier, the alternative count might have turned the preferred one with potential top in place around 550, termination of Intermediate Wave (5) Orange. If correct, near term target could be 460. Alternatively, 550 high could be Minor Wave 1 Grey of Intermediate Wave (5) Orange. In that case, the stock should stay above 413.
Invalidation point: 550.
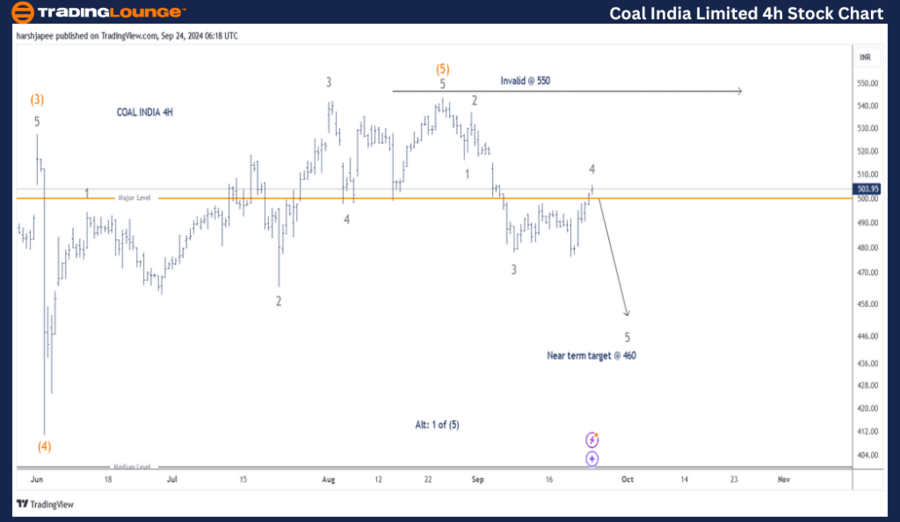
COAL INDIA 4H Chart Technical Analysis and potential Elliott Wave Counts:
COAL INDIA 4H structure has been adjusted from last week, indicating termination of Intermediate Wave (5) Orange around 550 mark. The sub waves since 550 have been marked as Minor Waves 1 through 4 Grey on the chart today.
If correct, the stock should witness another near term low around 460 levels in the next few trading sessions. Alternatively, the 550 high is just Minor Wave 1 of Intermediate Wave (5) and the recent drop is an expanded flat correction to terminate Minor Wave 2 Grey.
Conclusion:
COAL INDIA might have turned bearish against 550 high. Prices are now unfolding with the first impulse drop at Minor degree towards 460 at least.
Elliott Wave analyst: Harsh Japee.
COAL INDIA LTD – COALINDIA (1D chart) Elliott Wave technical analysis [Video]
Author

Peter Mathers
TradingLounge
Peter Mathers started actively trading in 1982. He began his career at Hoei and Shoin, a Japanese futures trading company.


