Coal India Ltd Elliott Wave technical analysis [Video]
![Coal India Ltd Elliott Wave technical analysis [Video]](https://editorial.fxstreet.com/images/TechnicalAnalysis/ChartPatterns/Chartism/generic-chart-19151967_XtraLarge.jpg)
Coal India Elliott Wave technical analysis
Function: Counter Trend Lower (Minor degree, Grey).
Mode: Corrective.
Structure: Potential impulse within larger degree correction.
Position: Lower degree waves are still unfolding hence not marked.
Details: As discussed earlier, the alternative count is now the preferred one with potential top in place around 550, termination of Intermediate Wave (5) Orange. The stock is dragging lower unfolding as potential impulse towards 400-05. Will update the counts by next week.
Invalidation point: 550.
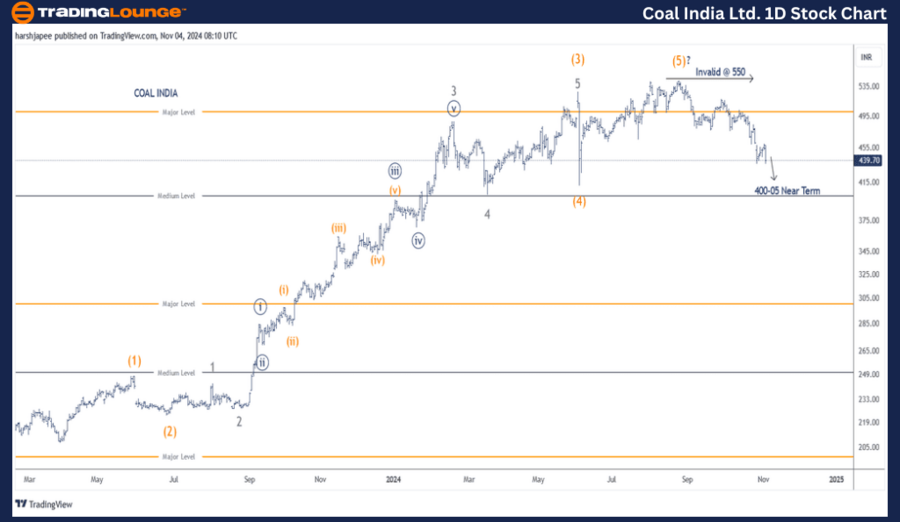
Coal India daily chart technical analysis and potential Elliott Wave counts
COAL INDIA daily chart indicates a larger degree uptrend complete around 550 mark; Intermediate Wave (5) on the chart; on August 26, 2024. If the above is correct, the stock should produce a much deeper correction against 550 high. The first impulse could complete near 400 levels near term.
The stock has rallied through fives waves after prices dropped around 210 lows in March 2023. Please note that Intermediate Wave (3) was extended, along with Minor Wave 3 within. Intermediate Wave (4) Orange was a sharp drop to 412 on June 04, 2024.
If the above is correct, COAL INDIA has now turned lower to produce a larger degree corrective wave, and prices should stay below 550 mark.
Coal India Ltd – Elliott Wave technical analysis
Function: Counter Trend Lower (Minor degree, Grey).
Mode: Corrective.
Structure: Potential impulse within larger degree correction.
Position: Lower degree waves are still unfolding hence not marked.
Details: As discussed earlier, the alternative count is now the preferred one with potential top in place around 550, termination of Intermediate Wave (5) Orange. The stock is dragging lower unfolding as potential impulse towards 400-05. Minute Wave ((iii)) of potential Minor Wave 1 could be unfolding or Wave C of A-B-C is in its last leg.
Invalidation point: 550.
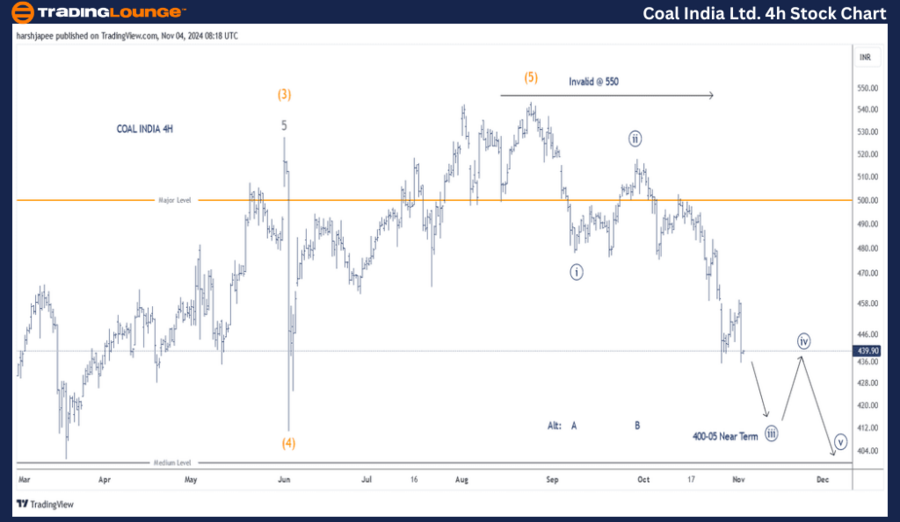
Coal India four-hour chart technical analysis and potential Elliott Wave counts
COAL INDIA 4H chart highlights the sub waves after hitting 550 high, Intermediate Wave (5) Orange. Potential Minute Wave ((iii)) of Minor Wave 1 is underway towards 400-05 range, which is also the previous Wave (4) termination.
Alternatively, the drop from 550 might be unfolding as an A-B-C correction, which could be into its final leg lower towards 400-05 level.
Conclusion
COAL INDIA could be unfolding its first impulse drop since 550 high or within Wave C of A-B-C correction towards 400 mark.
Coal India Ltd Elliott Wave technical analysis [Video]
Author

Peter Mathers
TradingLounge
Peter Mathers started actively trading in 1982. He began his career at Hoei and Shoin, a Japanese futures trading company.


