$CLF: Cleveland Cliffs heading for a next big rally

Cleveland Cliffs, Inc. (formerly Cliffs Natural Resources) is an US American company that specializes in the mining, beneficiation, and pelletizing of iron ore, as well as steelmaking, including stamping and tooling. It is the largest flat-rolled steel producer in North America. Founded in 1847, it is headquartered in Cleveland, Ohio, USA. The stock being a component of the S&P MidCap 400 index can be traded under ticker $CLF at NYSE.
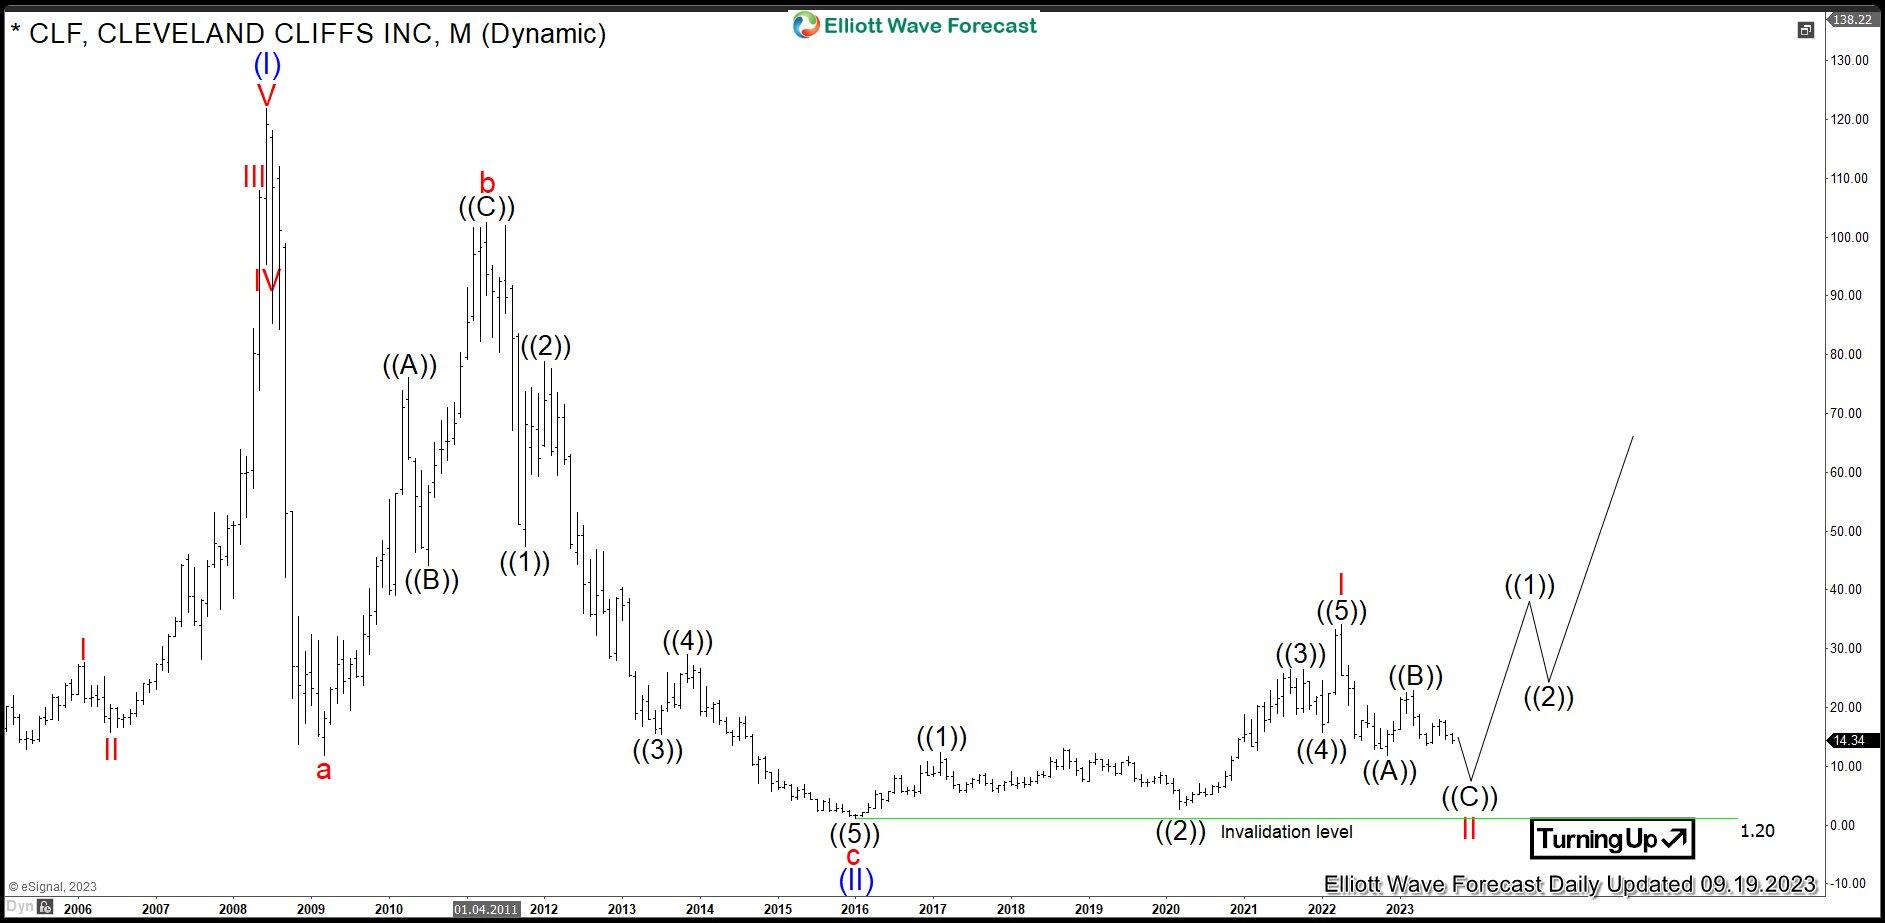
Cleveland Cliffs monthly Elliott Wave analysis 09.19.2023
The Monthly chart below shows the Cleveland Cliffs shares $CLF traded at NYSE. First, the stock price has developed an impulse higher in blue wave (I) of a super cycle degree. It has printed the all-time highs on the June 2008 at 121.95. From the highs, a correction lower in blue wave (II) has unfolded as an Elliott wave zigzag pattern. Firstly, red wave a has printed a low in March 2009 at 11.80. From the low, red wave b reached higher towards April 2011 highs and became a bull trap. From 102.48 highs, red wave c has broken below 11.80 lows. Hereby, the structure of red wave c allows to count 5 waves off the highs.
It is the the preffered view, that correction in red wave (II) has ended in January 2016. While above 1.20 lows, next bullish cycle in blue wave (III) has started. The target will be towards 123-199 area and beyond.
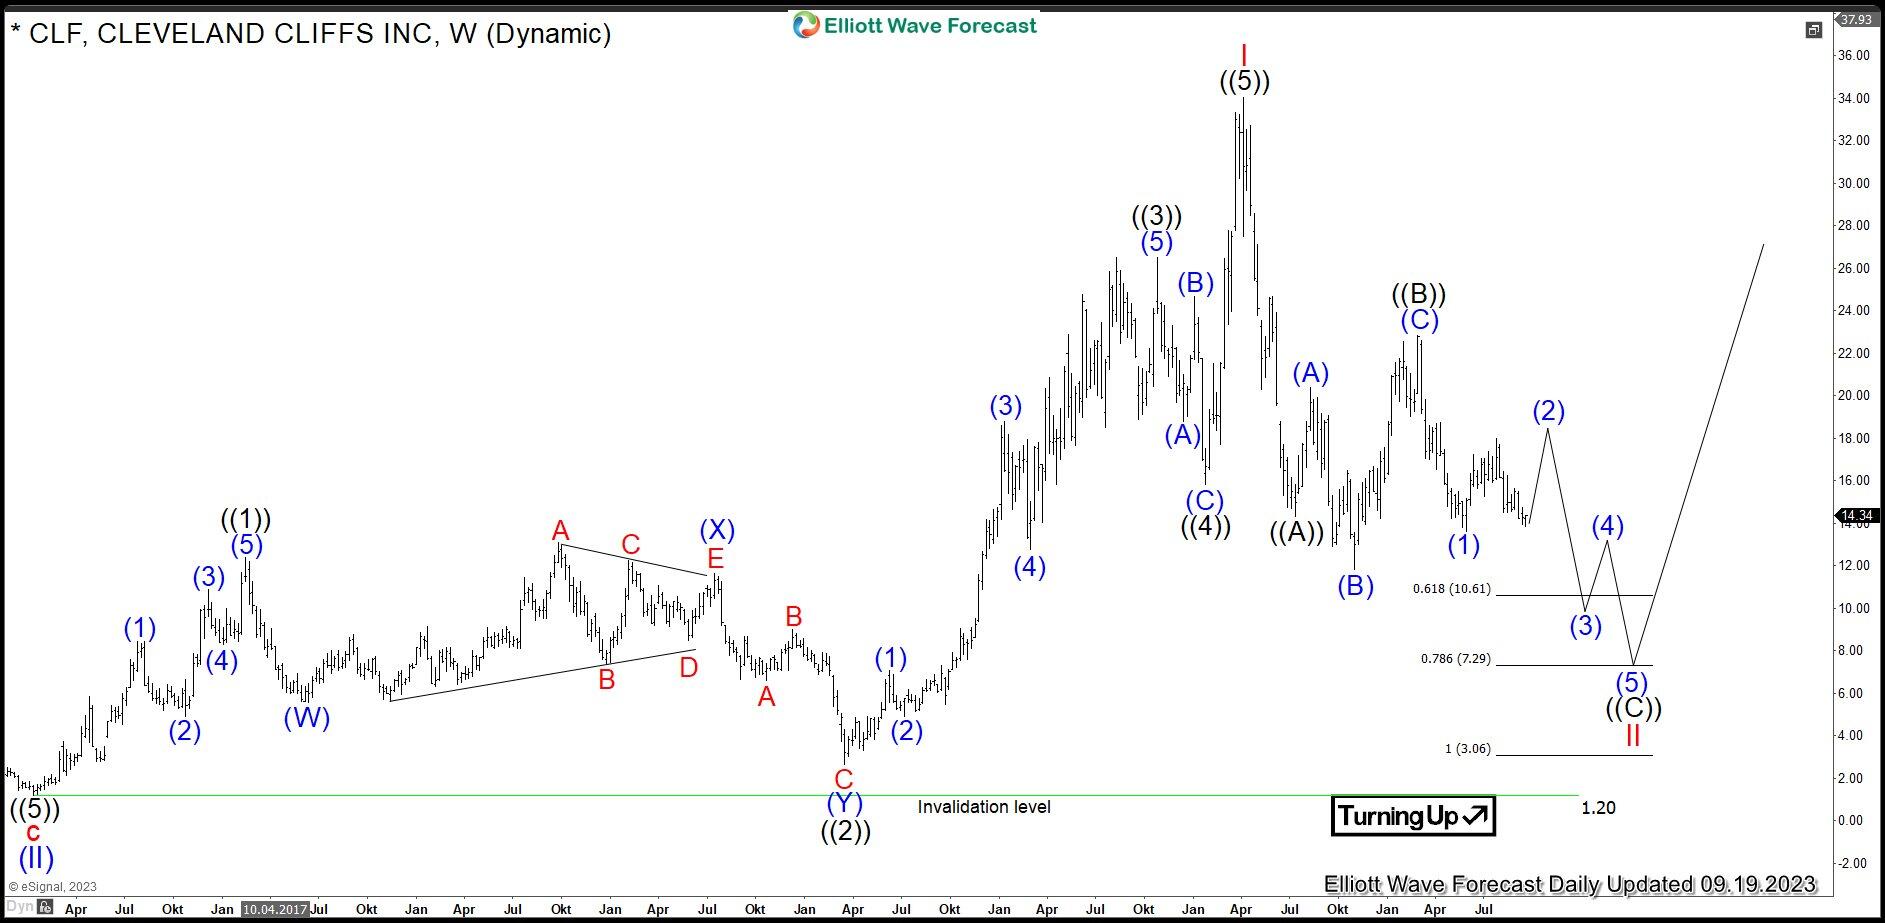
Cleveland Cliffs weekly Elliott Wave analysis 09.19.2023
The Weekly chart below shows in more detail the initial stages of the blue wave (III). Firstly, diagonal in black wave ((1)) has created a high in February 2017 at 12.37. Secondly, a pullback in black wave ((2)) has set a low in March 2020 at 2.63. Thirdly, an impulse in wave ((3)) has printed a peak in October 2021 at 26.51. Fourthly, a reset in black wave ((4)) has set a short-term low in January 2022. Finally, blue wave ((5)) has reached 34.04 highs in April 2022. There, an impulse in red wave I has ended.
From April 2022 highs at 34.04, a consolidation lower in red wave II is taking place and should find support in 3, 7 swings above 1.20 lows. Firstly, impulse in black wave ((A)) has printed a short-term low in July 2022. From 14.32 lows, a bounce as expanded flat in black wave ((B)) has set a connector at 22.83 highs in March 2023. From there, black wave wave ((C)) has started. Break of 11.82 lows will confirm that. It can reach 10.61-7.29 area. Also full 100% extension being 3.06-1.20 area might be reached. Investors can start accumalation from 10.61-1.20 area targeting 123-199 area in the long run.
Author

Elliott Wave Forecast Team
ElliottWave-Forecast.com


