- Citigroup (C) will announce earnings later this week on Friday.
- Financial stocks have started 2022 strongly, benefitting from higher yields.
- Citi (C) and others also benefit from a rotatation out of growth.
Citigroup (C) shares kicked on last Friday continuing their recent strong start to the year. 2022 so far has seen the Fed adopt an aggressive posture which has not endeared investors toward growth stocks. The Nasdaq has stuttered into 2022 but financial stocks, by comparison, are powering ahead. Apologies if some readers find this self-explanatory but higher interest rates are generally good for commercial bank stocks who can increase the margin between deposits and borrowings. This flows directly to the bottom line for little additional costs. So far Citigroup (C) stock is up 9% for 2022.
Citigroup (C) stock news
Not stock specific but certainly related to the times we live in, various outlets report that Citi is preparing to fire workers who refuse to be vaccinated against covid. Bloomberg says the deadline is the end of January, it appears they were the first to break the news. Workers will be placed on leave on January 14 if they are not vaccinated.
Back to financial matters now and all eyes will be on Citigroup's earnings this Friday. Earnings per share (EPS) is slated to come in at $1.71 and revenue is estimated to hit $16.98 billion. Citi has surprised to the upside for the last number of quarters. Indeed we have to go back to 2017 for the last time EPS did not come in ahead of results. Revenue did miss slightly in Q4 last year but otherwise, it has been a continuous string of earnings beats. With many analysts now penciling in an even more aggressive Fed than thought, this should further underpin financial stocks performance.
Citigroup (C) stock forecast
Citi (C) put in a perfect double bottom between February and December 2021. A double bottom is a strongly bullish reversal signal and so it has proven. Last week the stock put in a huge green candle on the weekly chart.
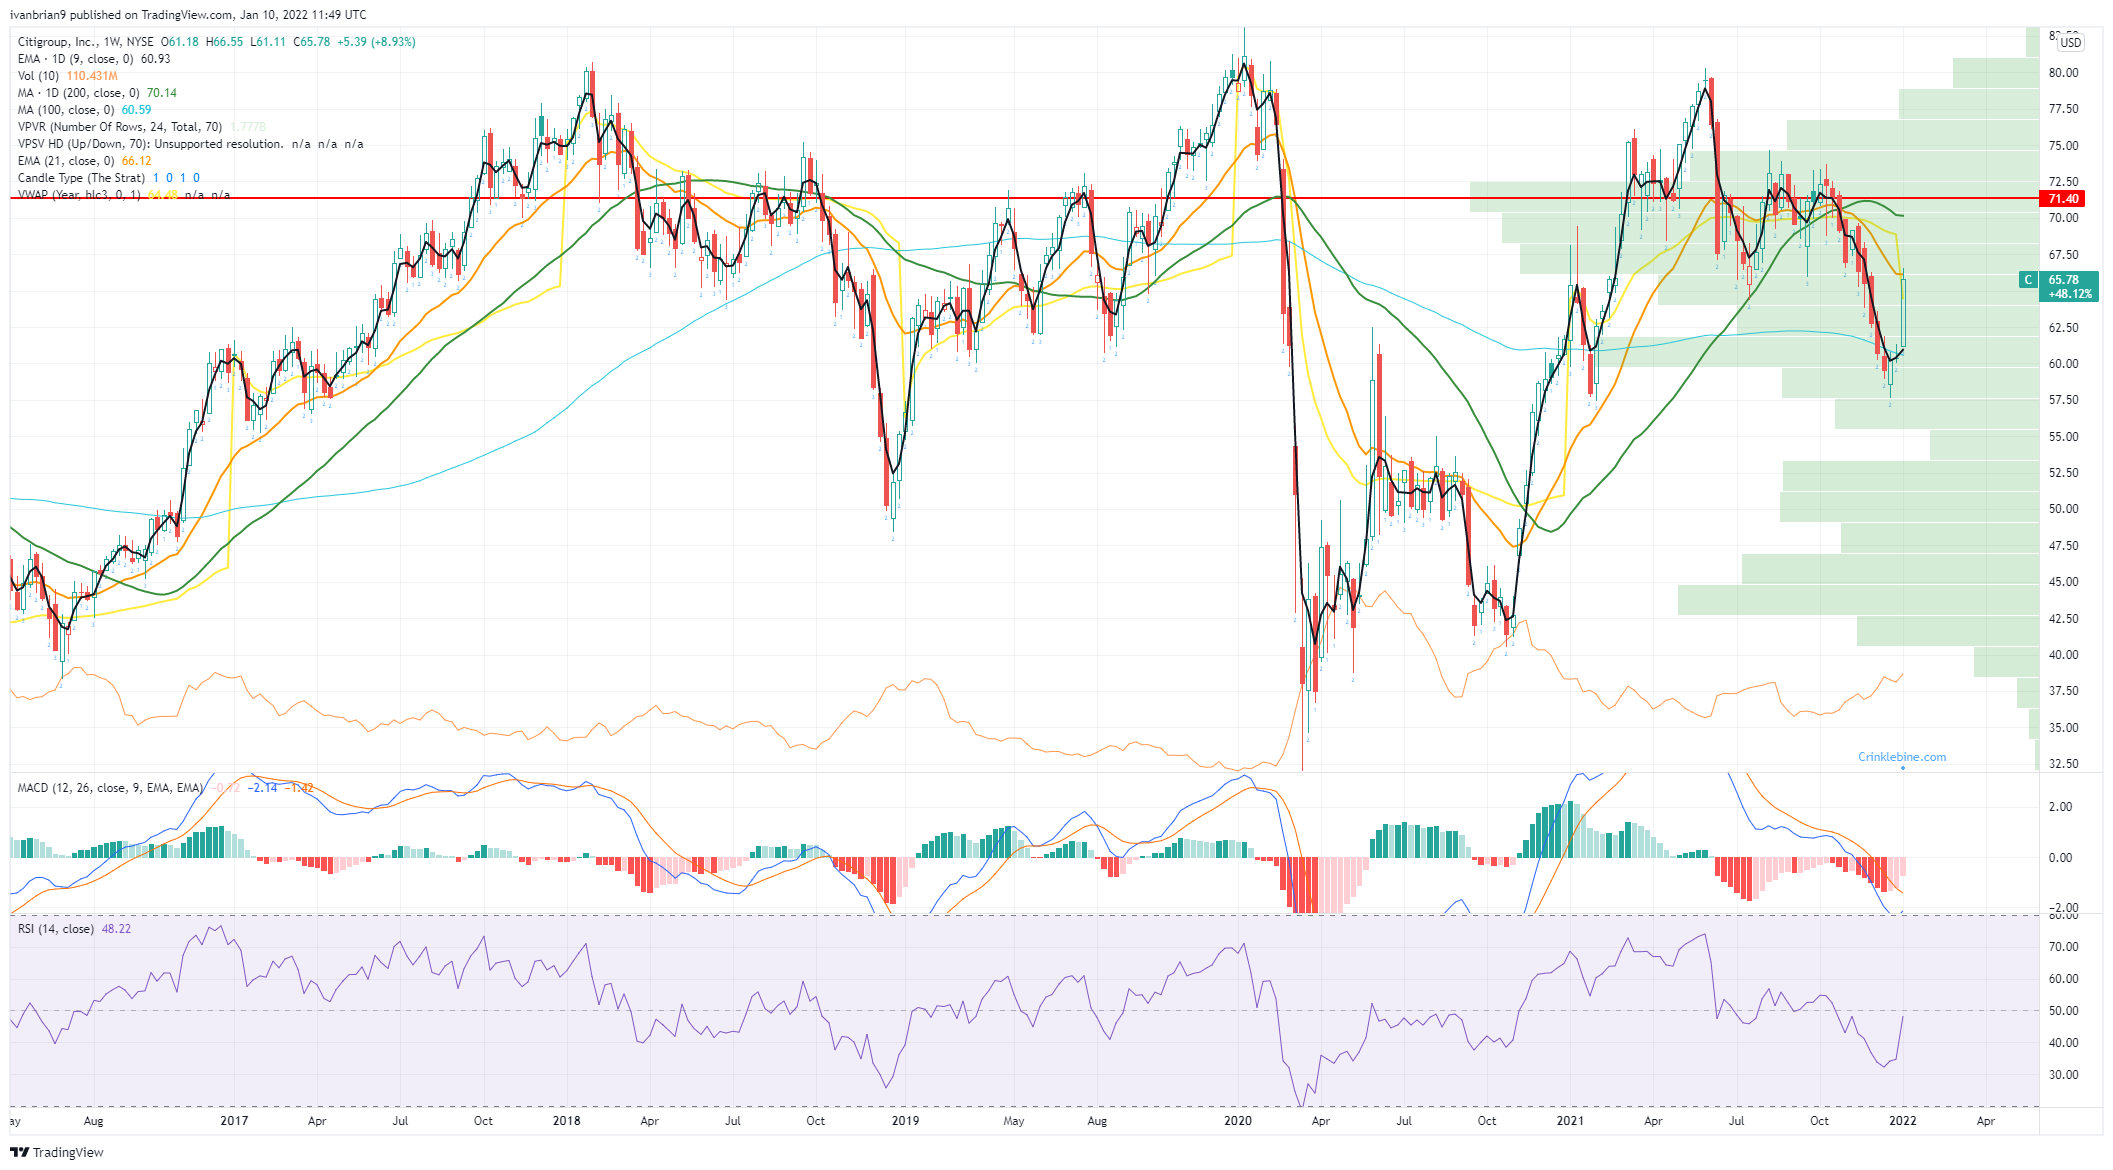
Citigroup (C) weekly chart
The daily chart shows resistance at $66.50 from the low in early November. When this level broke it signified the end of the series of higher lows and was key to the late year-end slump. Breaking above will be a powerful signal putting the 200-day next insight at $70. Expect earnings to be the catalyst.
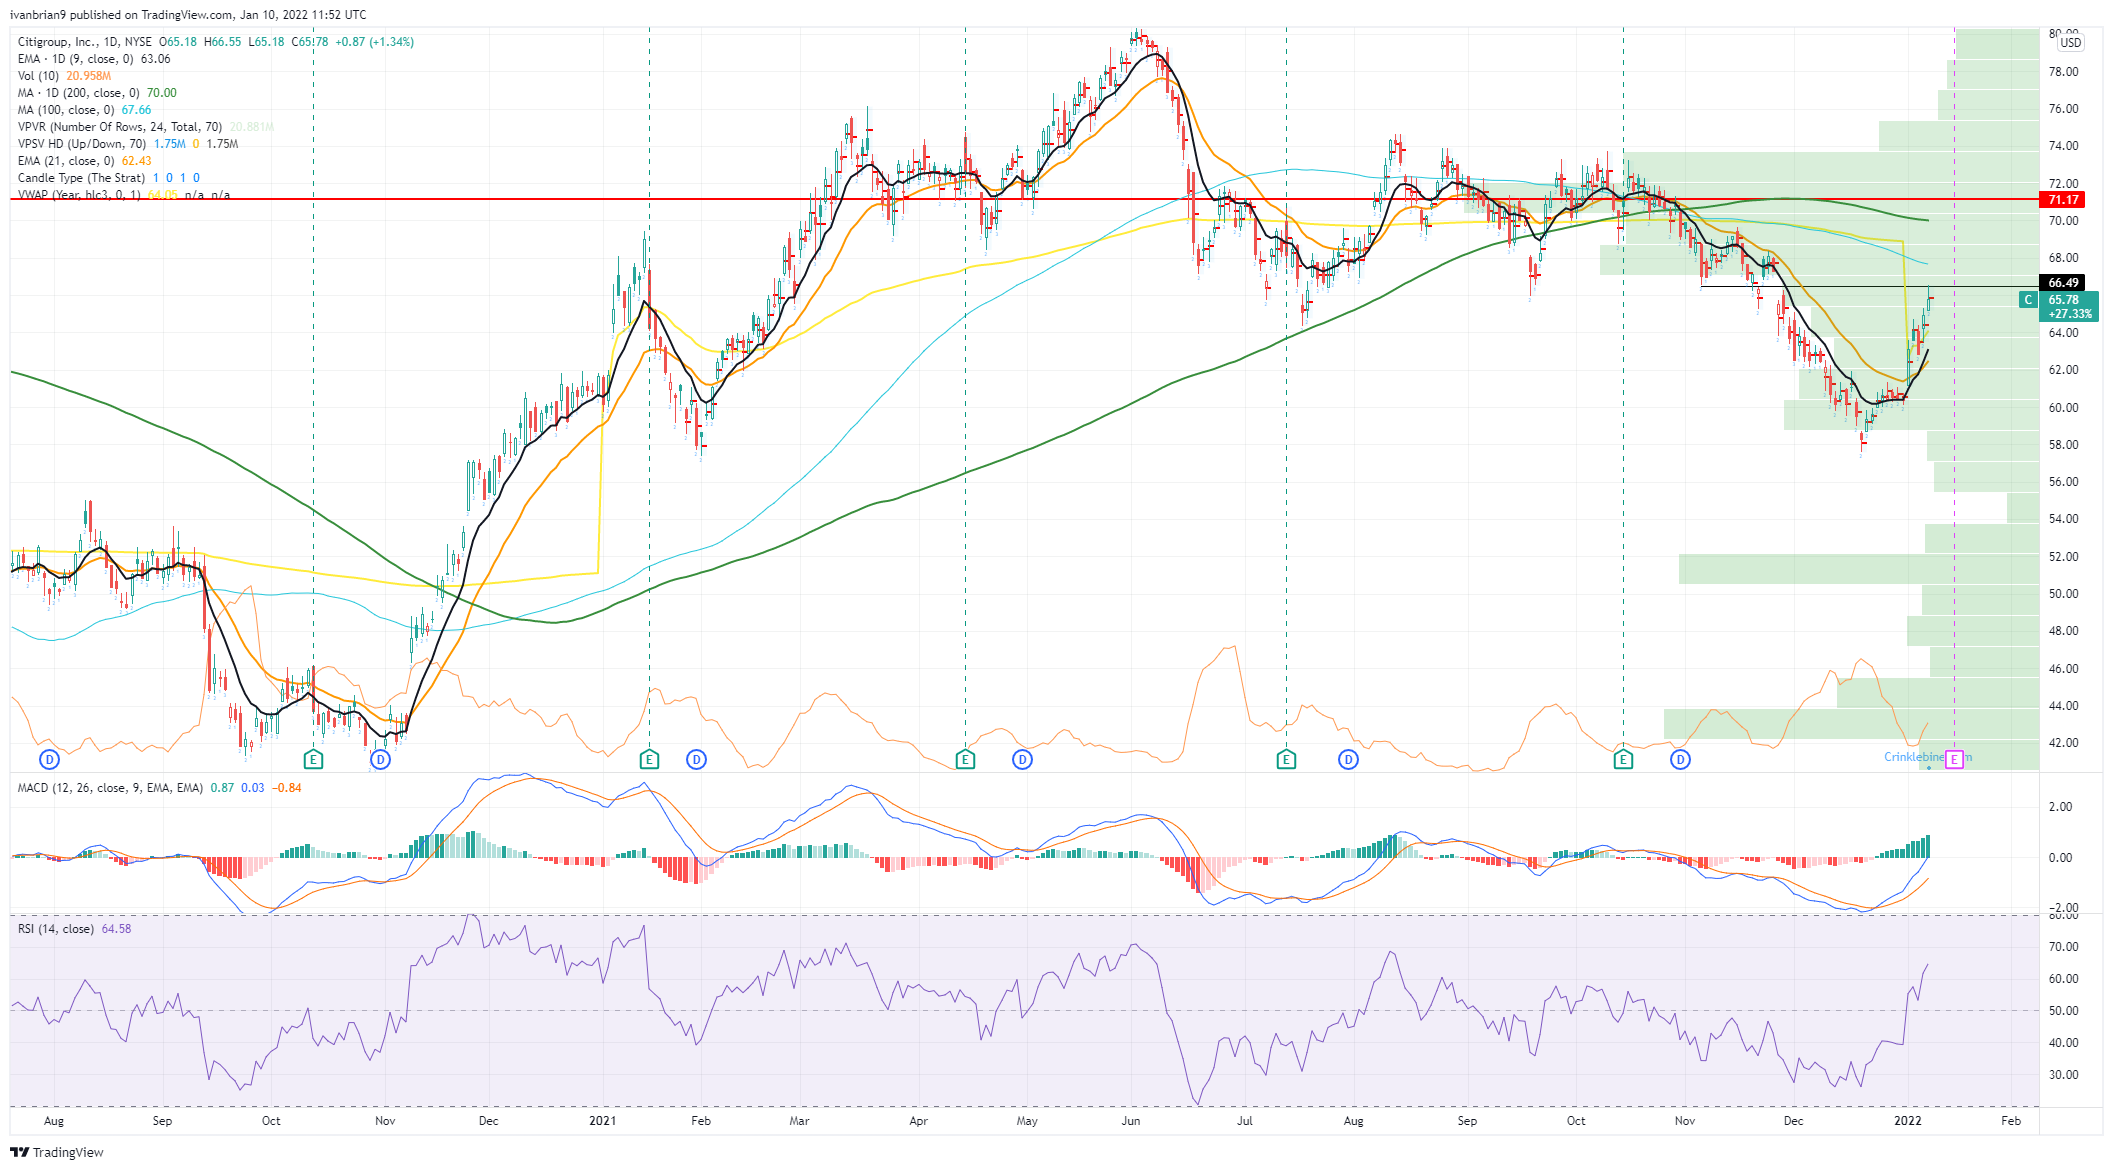
Citigroup chart, daily
Like this article? Help us with some feedback by answering this survey:
Information on these pages contains forward-looking statements that involve risks and uncertainties. Markets and instruments profiled on this page are for informational purposes only and should not in any way come across as a recommendation to buy or sell in these assets. You should do your own thorough research before making any investment decisions. FXStreet does not in any way guarantee that this information is free from mistakes, errors, or material misstatements. It also does not guarantee that this information is of a timely nature. Investing in Open Markets involves a great deal of risk, including the loss of all or a portion of your investment, as well as emotional distress. All risks, losses and costs associated with investing, including total loss of principal, are your responsibility. The views and opinions expressed in this article are those of the authors and do not necessarily reflect the official policy or position of FXStreet nor its advertisers. The author will not be held responsible for information that is found at the end of links posted on this page.
If not otherwise explicitly mentioned in the body of the article, at the time of writing, the author has no position in any stock mentioned in this article and no business relationship with any company mentioned. The author has not received compensation for writing this article, other than from FXStreet.
FXStreet and the author do not provide personalized recommendations. The author makes no representations as to the accuracy, completeness, or suitability of this information. FXStreet and the author will not be liable for any errors, omissions or any losses, injuries or damages arising from this information and its display or use. Errors and omissions excepted.
The author and FXStreet are not registered investment advisors and nothing in this article is intended to be investment advice.


Recommended content
Editors’ Picks

EUR/USD remains offered in the low-1.0900s
The generalised selling pressure continues to weigh on the risk complex, pushing EUR/USD back toward the 1.0900 support level amid a growing risk-off mood, as traders assess President Trump’s reciprocal tariffs and their impact on economic activity.

GBP/USD retreats further and breaks below 1.2800
The US Dollar is picking up extra pace and flirting with daily highs, sending GBP/USD to multi-week lows near 1.2770 in a context where safe-haven demand continues to dictate sentiment amid the chaos of US tariffs.

Gold recedes to four-week lows near $2,950
The persistent selling pressure is now dragging Gold prices to the area of fresh multi-week troughs near the $2,950 mark per troy ounce, always amid the continuation of the recovery in the US Dollar, highr US yields across the curve and unabated tariff tensions.

US stock market suddenly reverses higher after rumor of 90-day tariff pause before sinking again Premium
NASDAQ sinks 4% before shooting higher on tariff pause rumor. CNBC says White House unaware of tariff pause rumor. S&P 500 sinks to January 2024 level. Bank of America cuts its year-end target for S&P 500 by 16%.

Strategic implications of “Liberation Day”
Liberation Day in the United States came with extremely protectionist and inward-looking tariff policy aimed at just about all U.S. trading partners. In this report, we outline some of the more strategic implications of Liberation Day and developments we will be paying close attention to going forward.

The Best brokers to trade EUR/USD
SPONSORED Discover the top brokers for trading EUR/USD in 2025. Our list features brokers with competitive spreads, fast execution, and powerful platforms. Whether you're a beginner or an expert, find the right partner to navigate the dynamic Forex market.