CVX Elliott Wave Analysis Trading Lounge.
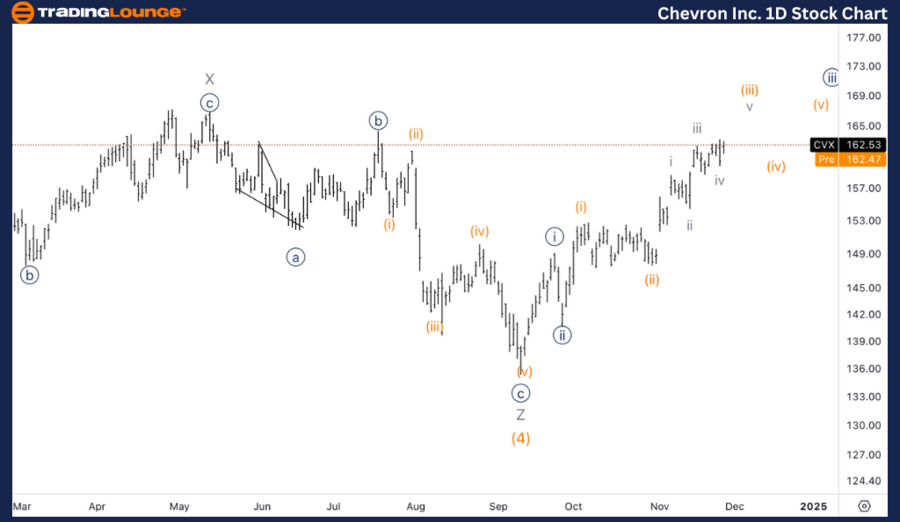
Chevron Inc., (CVX) Daily Chart.
CVX Elliott Wave technical analysis
Function: Trend.
Mode: Impulsive.
Structure: Motive.
Position: Minute {iii}.
Direction: Upside within {iii}.
Details: Looking for upside into wave {iii} as we seem to be missing another wave (iii) and (iv) within {iii}, suggesting we could get towards 200$.
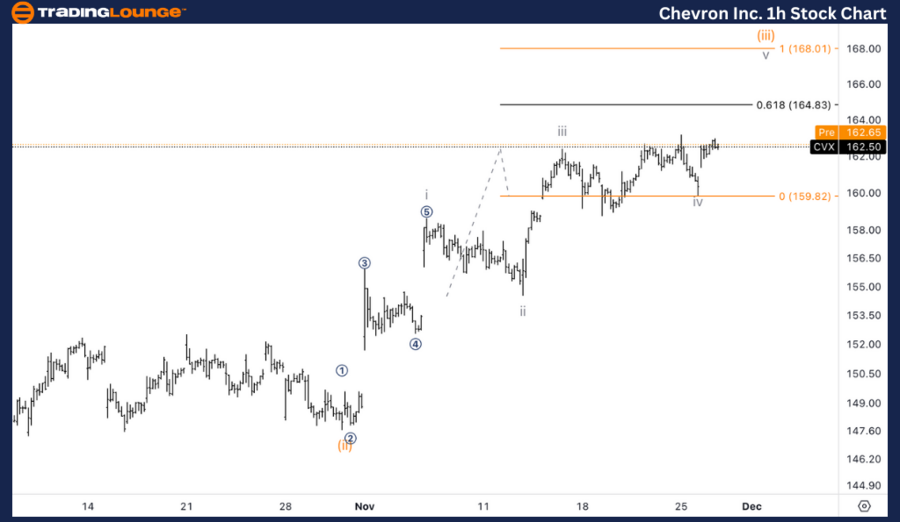
Chevron Inc., (CVX) 1H Chart.
CVX Elliott Wave technical analysis
Function: Trend.
Mode: Impulsive.
Structure: Motive.
Position: Wave (iii) of {iii}.
Direction: Upside in wave v of (iii).
Details: Looking for upside into wave (iii) as we seem to be missing another leg higher into wave v. As iii was shorter than i, v must be shorter than iii so we should expect equality at 168$ as maximum target.
This analysis focuses on the current trend structure of Chevron Inc., (CVX) utilizing the Elliott Wave Theory on both the daily and 1-hour charts. Below is a breakdown of the stock's position and potential future movements.
CVX Elliott Wave technical analysis – Daily chart
Chevron (CVX) is progressing within minute wave {iii} of the larger impulsive structure, with additional upside expected. There appears to be missing subdivisions for waves (iii) and (iv) within {iii}, suggesting a further extension in this move. The target for this wave structure lies near $200, marking the expected completion of wave {iii}.
CVX Elliott Wave technical analysis – One-hour chart
On the 1-hour chart, Chevron is advancing within wave v of (iii). With wave iii shorter than wave i, wave v is expected to be constrained to be shorter than wave iii, limiting its maximum target to $168 based on equality with previous wave structures. This suggests a measured but steady move higher in the near term as wave {iii} approaches completion.
Technical analyst: Alessio Barretta.
CVX Elliott Wave technical analysis [Video]
As with any investment opportunity there is a risk of making losses on investments that Trading Lounge expresses opinions on.
Historical results are no guarantee of future returns. Some investments are inherently riskier than others. At worst, you could lose your entire investment. TradingLounge™ uses a range of technical analysis tools, software and basic fundamental analysis as well as economic forecasts aimed at minimizing the potential for loss.
The advice we provide through our TradingLounge™ websites and our TradingLounge™ Membership has been prepared without considering your objectives, financial situation or needs. Reliance on such advice, information or data is at your own risk. The decision to trade and the method of trading is for you alone to decide. This information is of a general nature only, so you should, before acting upon any of the information or advice provided by us, consider the appropriateness of the advice considering your own objectives, financial situation or needs. Therefore, you should consult your financial advisor or accountant to determine whether trading in securities and derivatives products is appropriate for you considering your financial circumstances.
Recommended content
Editors’ Picks
EUR/USD recovers toward 1.0500 after mixed US PMI data
EUR/USD rebounds toward 1.0500 in the American session on Friday after the data from the US showed that the business activity in the private sector expanded at a softer pace than anticipated in early February. The pair remains on track to end the week with little changed.
GBP/USD rises above 1.2650, looks to post weekly gains
GBP/USD regains its traction and trades above 1.2650 in the second half of the day on Friday. The data from the US showed that the S&P Global Services PMI dropped into the contraction territory below 50 in February, causing the US Dollar to lose strength and helping the pair edge higher.
Gold holds above $2,930 as US yields edge lower
Gold holds above $2,930 after correcting from the record-high it set above $2,950 on Thursday. Following the mixed PMI data from the US, the benchmark 10-year US Treasury bond yield stays in negative territory below 4.5% and allows XAU/USD to hold its ground.
Crypto exchange Bybit hacked for $1.4 billion worth of ETH
Following a security breach first spotted by crypto investigator ZachXBT, crypto exchange Bybit announced that it suffered a hack where an attacker compromised one of its ETH wallets.
Money market outlook 2025: Trends and dynamics in the Eurozone, US, and UK
We delve into the world of money market funds. Distinct dynamics are at play in the US, eurozone, and UK. In the US, repo rates are more attractive, and bills are expected to appreciate. It's also worth noting that the Fed might cut rates more than anticipated, similar to the UK. In the eurozone, unsecured rates remain elevated.
The Best brokers to trade EUR/USD
SPONSORED Discover the top brokers for trading EUR/USD in 2025. Our list features brokers with competitive spreads, fast execution, and powerful platforms. Whether you're a beginner or an expert, find the right partner to navigate the dynamic Forex market.