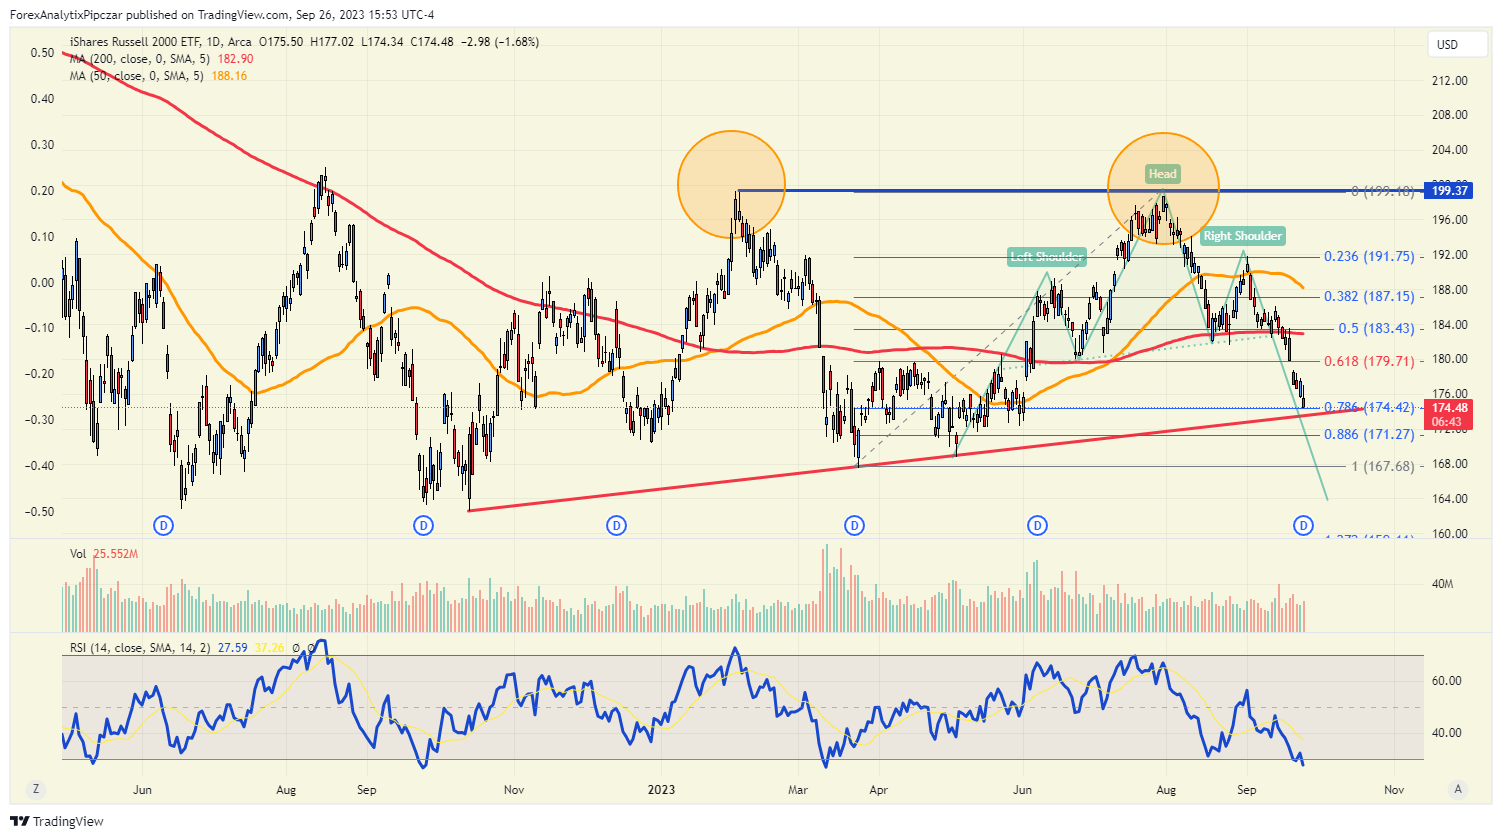
Chart of the day – Russell 2000
Russell 2000 approaching key support
We have discussed the Russell 2000 head and shoulder pattern and long-term double top on many venues, whether this weekend's Week Ahead" video, or on our daily FACE shows, it's a familiar chart. However, the daily RSI has just reached oversold. Oversold and become MORE oversold and the pattern targets are actually towards 2022 lows, but the 78% retracement of the March lows to July 2023 highs is at 174.42, and the ascending trend line of the Oct 2022 lows to present day is not far away. These may be levels that provide a bounce and better levels to be on the short side like closer to 180 vs where we currently trade at 174.50.
Author

Blake Morrow
Forex Analytix
Blake Morrow spent most of his professional career as the Chief Currency Strategist for Wizetrade group for 15 years, and then the Senior Currency Strategist for Ally Financial after the acquisition of Tradeking which owned the Wizetrade Group.


