|premium|

Centennial Resource Development, Inc. (CDEV Stock) should supported and extend higher

Centennial Resource Development, Inc. (CDEV), is an independent Oil & Natural gas company from Energy Sector, focuses on the development of unconventional oil & associated liquid-rich natural gas reserves in the US. It trades under the CDEV ticker at Nasdaq.

CDEV – Elliott Wave view on daily chart

Since 2016, CDEV made an all-time low at $0.24 in April-2020 during the global sell-off in early last year. Thereafter it started higher high sequence as an impulse & favors ((5))the wave up.

CDEV

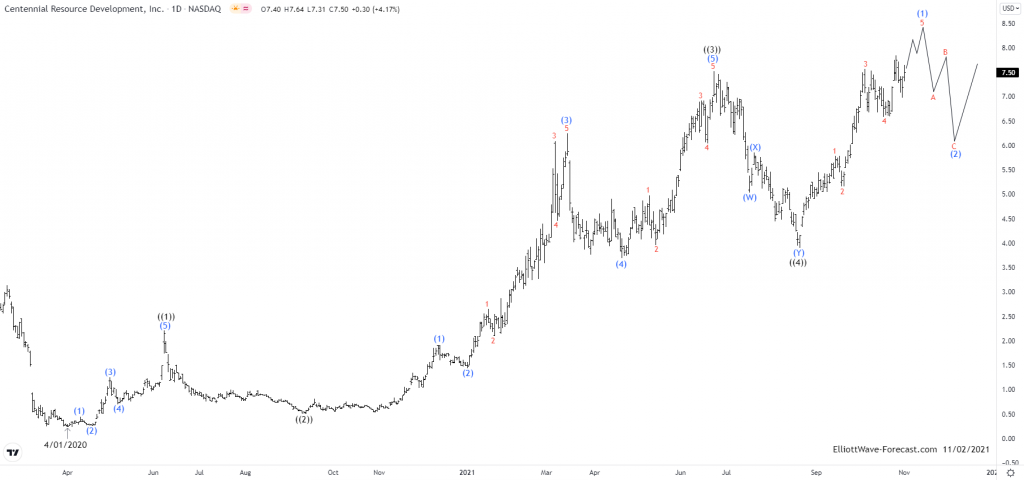
It started the impulse sequence as ((1)) from April-2020 low & ended at $2.21 high on 6/08/2020. The ((2)) was quite dip correction as 0.854 retracements against the previous cycle & ended at $0.51 low on 9/10/2020. Thereafter it started ((3)) as an extended move & favored ended at $7.52 high on 6/23/2021. While below there it placed ((4)) at $3.90 low on 8/20/2021. Thereafter it extends higher as the part of ((5)) up. It confirmed the higher high sequence by breaking above the previous high of ((3)). It suggests the next extension is higher in progress as (1) expecting one more high before it starts pulling back in (2). As far as the dips remain above $3.90 it expects to extend higher in ((5)).

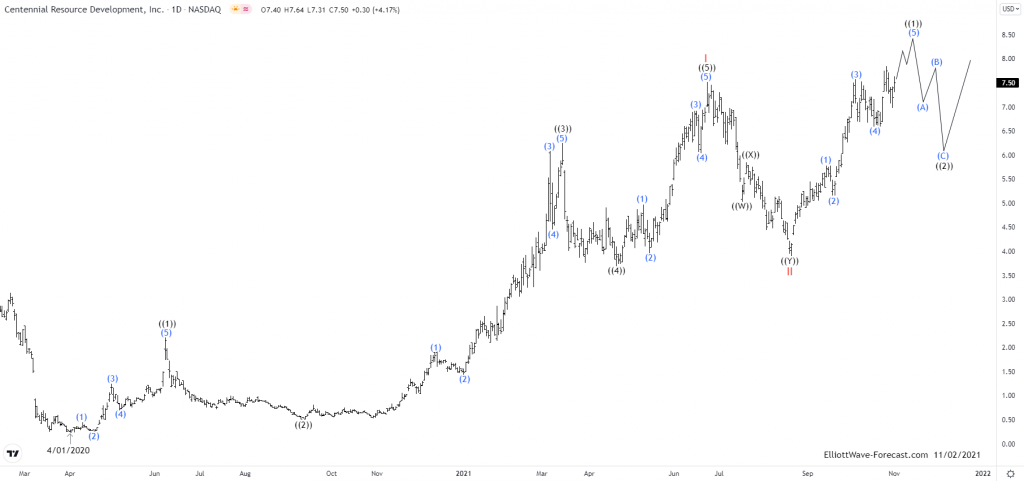
Alternatively, it has finished the impulse as I red at June-2021 peak & the correction as II at August- 2021 low & until dips remain above August low, it expects to extend higher as the part of III as shown in alternate view below. So both the views suggest that pullback should be supported and extend higher.

CDEV

Premium

You have reached your limit of 3 free articles for this month.

Start your subscription and get access to all our original articles.

Subscribe to PremiumSign In

Author

Elliott Wave Forecast Team

Elliott Wave Forecast Team

ElliottWave-Forecast.com

More from Elliott Wave Forecast Team
Share:

Editor's Picks

EUR/USD hits two-day highs near 1.1820

EUR/USD picks up pace and reaches two-day tops around 1.1820 at the end of the week. The pair’s move higher comes on the back of renewed weakness in the US Dollar amid growing talk that the Fed could deliver an interest rate cut as early as March. On the docket, the flash US Consumer Sentiment improves to 57.3 in February.

GBP/USD reclaims 1.3600 and above

GBP/USD reverses two straight days of losses, surpassing the key 1.3600 yardstick on Friday. Cable’s rebound comes as the Greenback slips away from two-week highs in response to some profit-taking mood and speculation of Fed rate cuts. In addition, hawkish comments from the BoE’s Pill are also collaborating with the quid’s improvement.

Gold climbs further, focus is back to 45,000

Gold regains upside traction and surpasses the $4,900 mark per troy ounce at the end of the week, shifting its attention to the critical $5,000 region. The move reflects a shift in risk sentiment, driving flows back towards traditional safe haven assets and supporting the yellow metal.

Crypto Today: Bitcoin, Ethereum, XRP rebound amid risk-off, $2.6 billion liquidation wave

Bitcoin edges up above $65,000 at the time of writing on Friday, as dust from the recent macro-triggered sell-off settles. The leading altcoin, Ethereum, hovers above $1,900, but resistance at $2,000 caps the upside. Meanwhile, Ripple has recorded the largest intraday jump among the three assets, up over 10% to $1.35.

Three scenarios for Japanese Yen ahead of snap election

The latest polls point to a dominant win for the ruling bloc at the upcoming Japanese snap election. The larger Sanae Takaichi’s mandate, the more investors fear faster implementation of tax cuts and spending plans. 

XRP rally extends as modest ETF inflows support recovery

Ripple is accelerating its recovery, trading above $1.36 at the time of writing on Friday, as investors adjust their positions following a turbulent week in the broader crypto market. The remittance token is up over 21% from its intraday low of $1.12.