Caterpillar Inc. (CAT) Elliott Wave technical analysis [Video]
![Caterpillar Inc. (CAT) Elliott Wave technical analysis [Video]](https://editorial.fxstreet.com/images/Markets/Equities/SP500/wall-street-sign-637299022550250958_XtraLarge.jpg)
CAT Elliott Wave Analysis Trading Lounge.
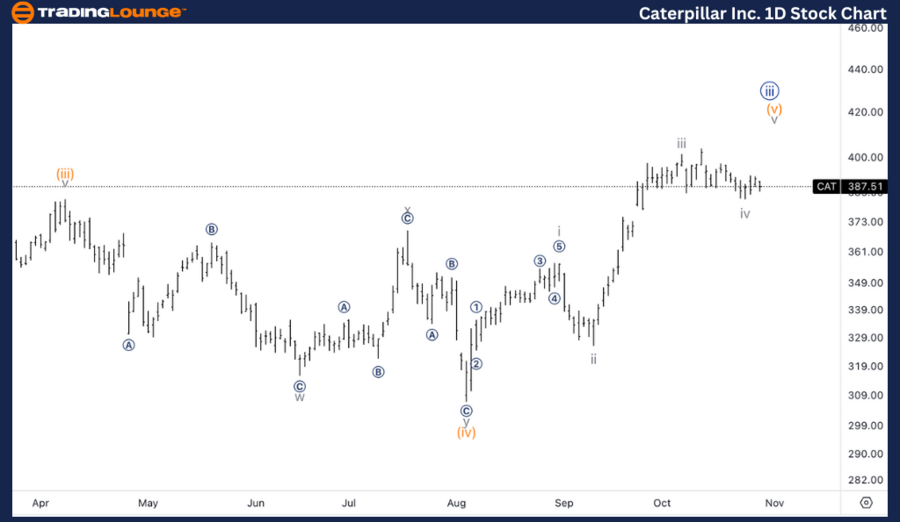
Caterpillar Inc., (CAT) Daily Chart.
CAT Elliott Wave technical analysis
Function: Trend.
Mode: Impulsive.
Structure: Motive.
Position: Wave {iii}.
Drection: Upside in wave (v) of {iii}.
Details: Looking for completion of wave (v), which could also turn out to be wave i of (v), suggesting more upside than expected could come.
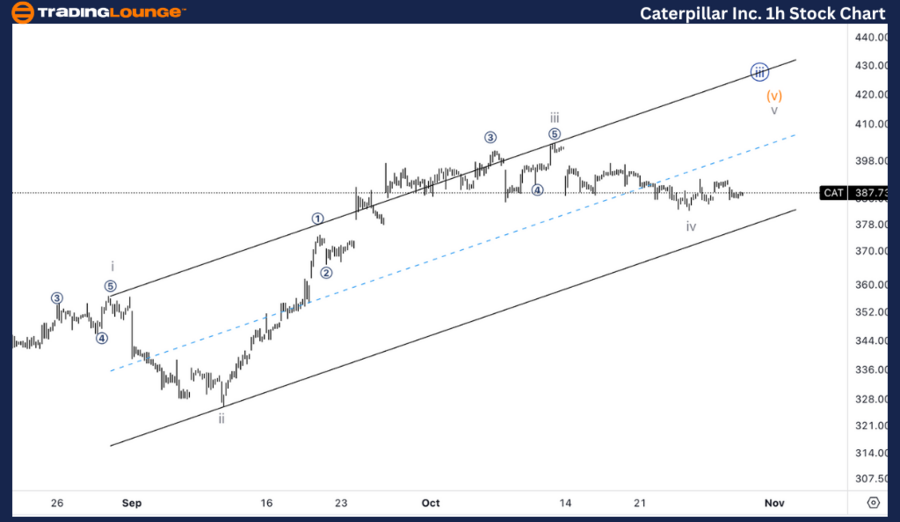
Caterpillar Inc., (CAT) 1H Chart.
CAT Elliott Wave technical analysis
Function: Trend.
Mode: Impulsive.
Structure: Motive.
Position: Wave iv.
Direction: Sideways in iv.
Details: Here we seem to be looking at a sideways wave iv that is nicely alternating with its corresponding wave ii, slowly approaching the parallel trend channel where we could expect support from.
This analysis focuses on the current trend structure of Caterpillar Inc., (CAT) utilizing the Elliott Wave Theory on both the daily and 1-hour charts. Below is a breakdown of the stock's position and potential future movements.
CAT Elliott Wave technical analysis – Daily chart
In the daily chart, CAT is currently in wave {iii}, with a focus on completing wave (v). This wave (v) could also signify the start of wave (i) of (v), indicating that further upside potential is likely beyond current expectations. Traders should remain alert for upward momentum as this wave unfolds.
CAT Elliott Wave technical analysis – One-hour chart
The 1-hour chart reveals a sideways wave iv that is showing a corrective pattern, nicely alternating with the previous wave ii. As CAT approaches the parallel trend channel, it is expected to find support, which may lead to a resumption of the upward trend. This consolidation phase can be a strategic opportunity for traders looking to enter or add to positions.
Technical analyst: Alessio Barretta.
CAT Elliott Wave technical analysis [Video]
Author

Peter Mathers
TradingLounge
Peter Mathers started actively trading in 1982. He began his career at Hoei and Shoin, a Japanese futures trading company.


