Caterpillar Inc (CAT) Elliott Wave technical analysis [Video]
![Caterpillar Inc (CAT) Elliott Wave technical analysis [Video]](https://editorial.fxstreet.com/images/Markets/Equities/DowJones/bloomberg-app-on-iphone-4-with-market-data-17118657_XtraLarge.jpg)
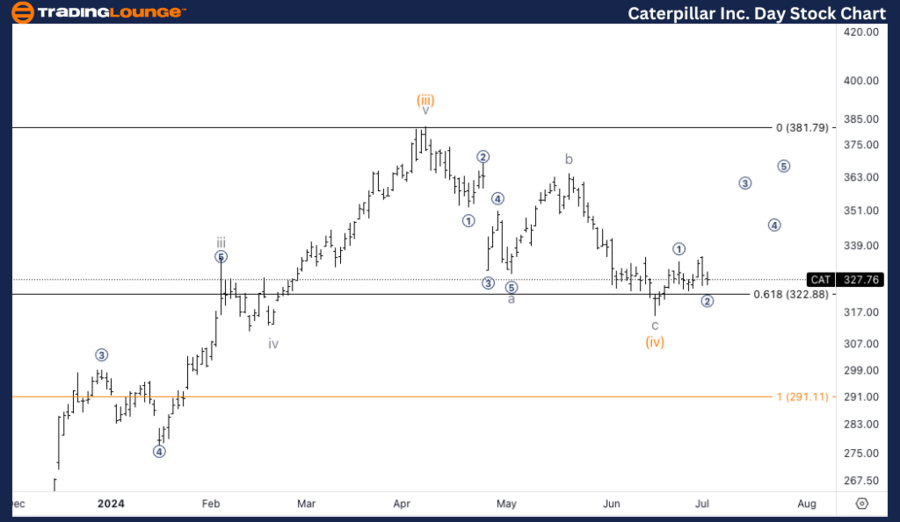
CAT Elliott Wave Analysis Trading Lounge Daily Chart,
Caterpillar Inc.,(CAT) Daily Chart.
CAT Elliott Wave technical analysis
Function: Trend.
Mode: Impulsive.
Structure: Motive.
Position: Minute wave (v).
Direction: Upside in wave (v).
Details: We are looking at Minuette wave (iv) reacting of 0.618 (iv) vs. (ii). Looking for a bottom in place to then resume the upside trend in wave (v).
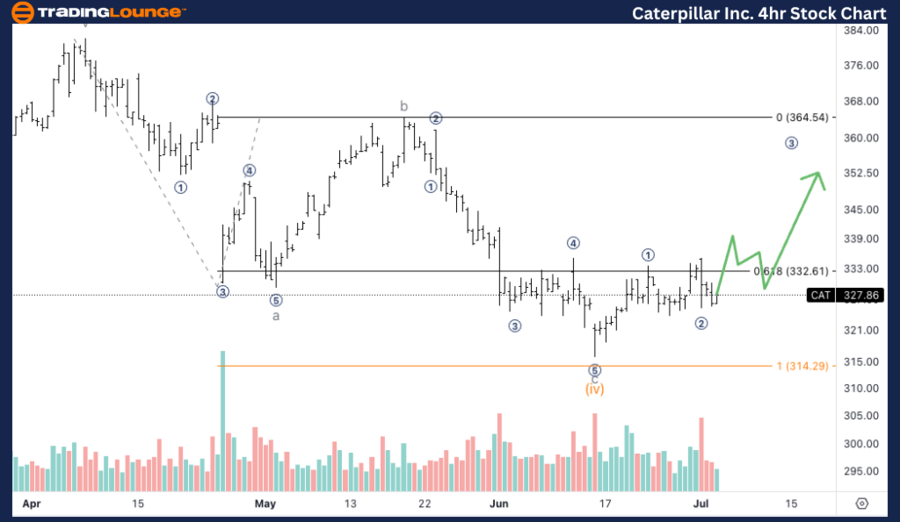
CAT Elliott Wave Analysis Trading Lounge 4Hr Chart,
Caterpillar Inc., (CAT) 4Hr Chart.
CAT Elliott Wave technical analysis
Function: Trend.
Mode: Impulsive.
Structure: Motive.
Position: Sub minuette i of (v).
Direction: Five waves into wave i.
Details: Looking for a micro wave 1-2 in place, looking for further upside into micro wave 3 looking to take off from Minor Group 1 at 330$.
Welcome to our latest Elliott Wave analysis for Caterpillar Inc. (CAT). This analysis delves into CAT's price movements through the lens of the Elliott Wave Theory, aiming to uncover potential trading opportunities based on current trends and market structures. We will examine both the daily and 4-hour charts to provide a thorough perspective on CAT's market behavior.
CAT Elliott Wave technical analysis – Daily chart
In our Elliott Wave analysis of Caterpillar Inc. (CAT), we observe an impulsive trend pattern with a motive structure. CAT is currently positioned in minute wave (v), indicating an ongoing upward trend. The recent price action shows that Minuette wave (iv) has reacted off the 0.618 retracement level of wave (iv) versus wave (ii), suggesting a potential bottom. This reaction provides a signal that CAT might resume its uptrend into minute wave (v), continuing the impulsive sequence.
CAT Elliott Wave technical analysis – Four-hour chart
In our Elliott Wave analysis of Caterpillar Inc. (CAT), we observe an impulsive trend pattern with a motive structure. CAT is currently positioned in minute wave (v), indicating an ongoing upward trend. The recent price action shows that Minuette wave (iv) has reacted off the 0.618 retracement level of wave (iv) versus wave (ii), suggesting a potential bottom. This reaction provides a signal that CAT might resume its uptrend into minute wave (v), continuing the impulsive sequence.
Technical analyst: Alessio Barretta.
CAT Elliott Wave technical analysis [Video]
Author

Peter Mathers
TradingLounge
Peter Mathers started actively trading in 1982. He began his career at Hoei and Shoin, a Japanese futures trading company.


