Can the NASDAQ100 reach new all-time highs this year?
Many of our premium members and others have been asking, “Contrary to Trump’s first presidency, this administration seems careless of financial markets and welcomes some economic pain. Will they cause a bear market?” And “What about Trump's tariffs and policies torpedoing the market?” With market sentiment pushing all-time lows and stress levels at all-time highs (something we’ve seen before), we are naturally asking whether the market might be broken. In short, these queries cast doubt on the narrative that has always bolstered confidence in the US stock markets. Because we’ve learned to “never bet against the US economy.”
However, by assessing the stock market’s price charts, we get an objective idea about their condition. In our previous update, we found by using the Elliott Wave (EW) for the NASDAQ100 (NDX) that
“…the index is likely completing an irregular expanded flat in EW terms: W>c>b>a. The ideal target is the 61.8% extension … at $19940, which the index is getting close to today … . If the index can hold that level, especially the 50% Fib-extension at $19646, we can look forward to ideally the 161.8% Fib-extension at $22434.”
The index failed to hold that level, bottoming at $19152 last week. As such, we have reassessed our EW count while still allowing for the irregular expanded flat scenario, albeit at a one-higher wave degree. See Figure 1 below.
NDX daily chart with detailed Elliott Wave count and technical indicators
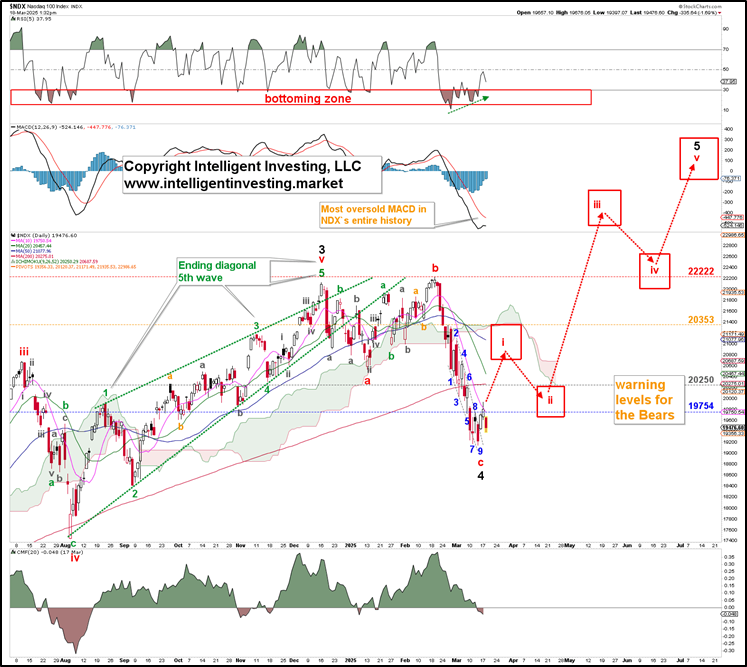
Since financial markets are stochastic and probabilistic, i.e., follow if/then scenarios, and why those who look for certainties will never stop searching, we must provide an alternative. Namely, the price action since December last year has been complex and hard to decipher. It produced a three-wave move down into the January low, followed by a three-wave move up into the February high. This can be part of an irregular flat, a 3-3-5 correction, as shown in Figure 1 above. Or it is part of a larger ending diagonal, a 3-3-3-3-3 pattern. See Figure 2 below.
NDX daily chart with detailed Elliott Wave count and technical indicators
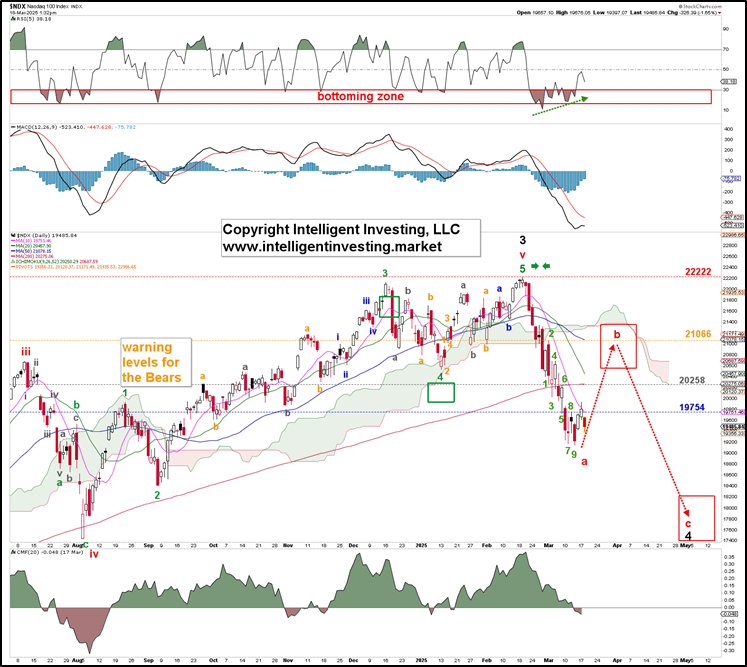
The former option suggests the correction is complete, and the NDX is ready to embark on a new five-wave rally to ultimately $24200-26500, with the red W-i first to around $21000+/-400. The path shown in Figure 1 is tentative because insufficient price data is available. Figure 2 shows the potential for a bounce to $20800+/-400, followed by a final leg lower (red W-c) to ideally $17800+/-400. Thus, we prefer to look higher, contingent on holding above last week's low.
Lastly, we want to share our big-picture overview. See Figure 3 below. In this case, the (black) W-1 is the 2020-2021 rally, and the 2022 Bear market is the W-2. The rally since is thus (part of) W-3. As such, the index has clearly only done three waves up from the March 2020 COVID low. Therefore, we expect another W-4, 5 sequence because the financial markets move in five waves up long-term.
NDX weekly chart with detailed Elliott Wave count and technical indicators
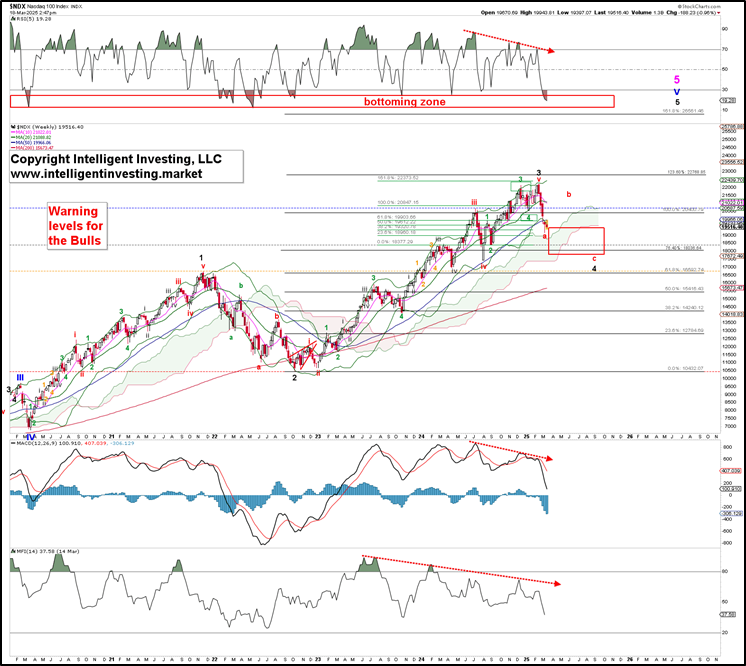
In a standard Fibonacci-based impulse pattern, the third-of-a-third wave, in this case (red) W-iii of (black) W-3, tends to target the 100-123.6% extension of W-1, measured from W-2. The fourth wave often returns to the 61.8-76.4% Fib-extension, followed by a fifth wave targeting ideally the 138.2-161.8% extension to complete the more significant third wave. However, the latter doesn’t have to reach that high; it can also be stunted at the 123.6% extension. As long as the 3rd wave is not the shortest wave of the three waves that move higher (W-1, 3, and 5), it can expand or contract.
In this case, the red W-iii reached the 100% Fib-extension, whereas the red W-iv bottomed right between the red 61.80 and 76.40% extensions. Then, the February high came within 546 points (2.4%) of the 123.6% extension. So far, so good. Since 4th waves often retrace 23.6-38.2% of the prior 3rd wave, red box in Figure 3, it can tag the 76.4% extension at around $18000 per the more extensive W-a-b-c sequence, right around the 38.2% retracement.
Even if the index would reach the 61.8% extension at ~$16600, the Bull case would still be alive, albeit put under pressure as, in that case, the 5th wave can still reach the 161.8% extension at ~$26500 to complete an enormous ending diagonal 5th wave from the March 2020 low. However, we remain humble and recognize a break below $16600 means our assessment is wrong and that a much more significant high has been struck, even if that would be unorthodox.
Author

Dr. Arnout Ter Schure
Intelligent Investing, LLC
After having worked for over ten years within the field of energy and the environment, Dr.


