The performance of Micron Technology Inc. (MU) stock has been a constant topic of interest in financial markets. Despite strong projections and a track record of innovation in the semiconductor industry, the ability of its stock to sustain a significant rally could be challenged by economic and sector-specific factors. In this article, we will explore the challenges and opportunities Micron faces on its path to sustainable recovery, as well as the potential impact of these dynamics on investors.
MU weekly chart October 2024
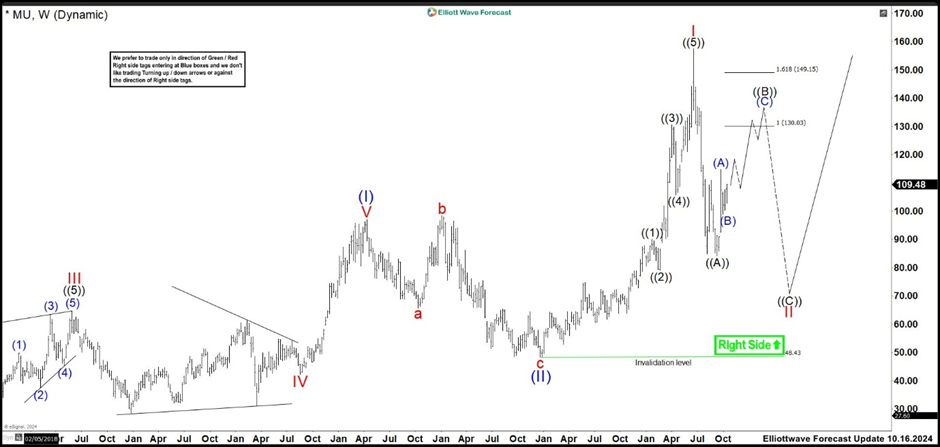
In the last weekly chart of October 2024, MU made a bearish impulse ending at $84.12 low, and we labeled this as wave ((A)) of II. Then, we were anticipating a corrective wave ((B)). Wave (A) ended at $106.75 high, and we identified the correction wave (B) as completed at $98.94 low. We stated that wave (C) had already started a new rally, and we expected it to reach the $130.03–$149.15 area to culminate wave ((B)) and turn lower into ((C)). This idea was valid as long as the market remained below $157.57 or above $48.43. If the market would break above wave I high, then wave II would have already ended.
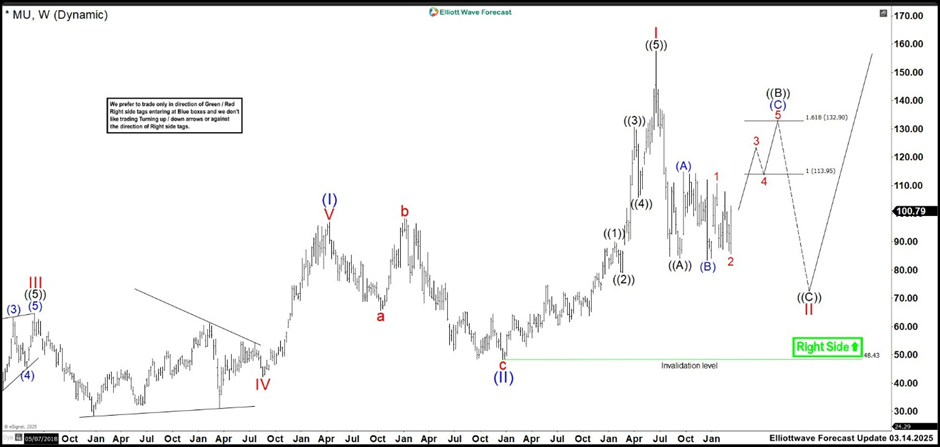
MU weekly chart March 2025
MU shows potential to recover its stock price as technological advancements and a memory market rebound drive growth later in 2025. However, demand fluctuations, global economic pressures, or unexpected market shifts create uncertainty around this recovery. The outlook highlights growth opportunities, but investors must monitor market volatility, which could undermine the rally’s sustainability.
The price broke below wave ((A)) low, which suggests wave ((B)) may be completed instead of wave (A). However, the ranging movement more likely indicates wave ((B)) is forming an expanding flat correction. We labeled wave (B) at the 83.54 low, and wave (C) is now progressing as an impulse or an ending diagonal structure. The chart illustrates an upward impulse, targeting the 113.95–132.90 area for wave (C) and ((B)). Afterward, the market will likely react lower to continue wave ((C)) of II. While wave II may already be finished, we are conservatively labeling this rally as part of an expanding flat correction. If MU breaks above wave I high, it confirms wave II is complete. Conversely, if the market breaks below wave (B), wave ((B)) is complete, and wave ((C)) begins moving downward.
FURTHER DISCLOSURES AND DISCLAIMER CONCERNING RISK, RESPONSIBILITY AND LIABILITY Trading in the Foreign Exchange market is a challenging opportunity where above average returns are available for educated and experienced investors who are willing to take above average risk. However, before deciding to participate in Foreign Exchange (FX) trading, you should carefully consider your investment objectives, level of xperience and risk appetite. Do not invest or trade capital you cannot afford to lose. EME PROCESSING AND CONSULTING, LLC, THEIR REPRESENTATIVES, AND ANYONE WORKING FOR OR WITHIN WWW.ELLIOTTWAVE- FORECAST.COM is not responsible for any loss from any form of distributed advice, signal, analysis, or content. Again, we fully DISCLOSE to the Subscriber base that the Service as a whole, the individual Parties, Representatives, or owners shall not be liable to any and all Subscribers for any losses or damages as a result of any action taken by the Subscriber from any trade idea or signal posted on the website(s) distributed through any form of social-media, email, the website, and/or any other electronic, written, verbal, or future form of communication . All analysis, trading signals, trading recommendations, all charts, communicated interpretations of the wave counts, and all content from any media form produced by www.Elliottwave-forecast.com and/or the Representatives are solely the opinions and best efforts of the respective author(s). In general Forex instruments are highly leveraged, and traders can lose some or all of their initial margin funds. All content provided by www.Elliottwave-forecast.com is expressed in good faith and is intended to help Subscribers succeed in the marketplace, but it is never guaranteed. There is no “holy grail” to trading or forecasting the market and we are wrong sometimes like everyone else. Please understand and accept the risk involved when making any trading and/or investment decision. UNDERSTAND that all the content we provide is protected through copyright of EME PROCESSING AND CONSULTING, LLC. It is illegal to disseminate in any form of communication any part or all of our proprietary information without specific authorization. UNDERSTAND that you also agree to not allow persons that are not PAID SUBSCRIBERS to view any of the content not released publicly. IF YOU ARE FOUND TO BE IN VIOLATION OF THESE RESTRICTIONS you or your firm (as the Subscriber) will be charged fully with no discount for one year subscription to our Premium Plus Plan at $1,799.88 for EACH person or firm who received any of our content illegally through the respected intermediary’s (Subscriber in violation of terms) channel(s) of communication.
Recommended content
Editors’ Picks

Gold refreshes all-time highs above $3,000 on escalating geopolitical tensions
Gold price is reneweing record highs beyond $3,000 early Tuesday on intensifying geopolitical Middle East tensions. Israel resumes military operations against Hamas in Gaza after the group rejected US proposals for extending ceasefire. Further US-Iran tensions add to the latest leg up in the safe-haven Gold.

EUR/USD holds below 1.0950, hopes of German fiscal deal might help limit its losses
The EUR/USD pair trades with mild losses around 1.0915 during the Asian session on Tuesday. Escalating trade war with further tariffs from US President Donald Trump on European Union goods weighs on the Euro.

GBP/USD moves below 1.3000, downside seems limited as US Dollar remains vulnerable
GBP/USD retreats after gaining in the previous session, hovering around 1.2970 during Asian trading on Tuesday. The pair faces pressure as the US Dollar attempts to recover losses from the last two sessions. However, downside movement may be limited as the Greenback remains vulnerable.

Ethereum consolidates below $2,000 as Standard Chartered alters its prediction for 2025
Ethereum remained just below $2,000 in the Asian session on Tuesday as Standard Chartered's Global Head of Digital Assets Research, Geoffrey Kendrick, updated the bank's 2025 price forecast for ETH.

Five Fundamentals for the week: Fed leads central bank parade as uncertainty remains extreme Premium
Central bank bonanza – perhaps its is not as exciting as comments from the White House, but central banks still have sway. They have a chance to share insights about the impact of tariffs, especially when they come from the world's most powerful central bank, the Fed.

The Best brokers to trade EUR/USD
SPONSORED Discover the top brokers for trading EUR/USD in 2025. Our list features brokers with competitive spreads, fast execution, and powerful platforms. Whether you're a beginner or an expert, find the right partner to navigate the dynamic Forex market.