CAC 40 (France) Elliott Wave technical analysis [Video]
![CAC 40 (France) Elliott Wave technical analysis [Video]](https://editorial.fxstreet.com/images/Markets/Equities/Industries/Semiconductors/pic-man-repairing-semiconductors-637435354060707899_XtraLarge.jpg)
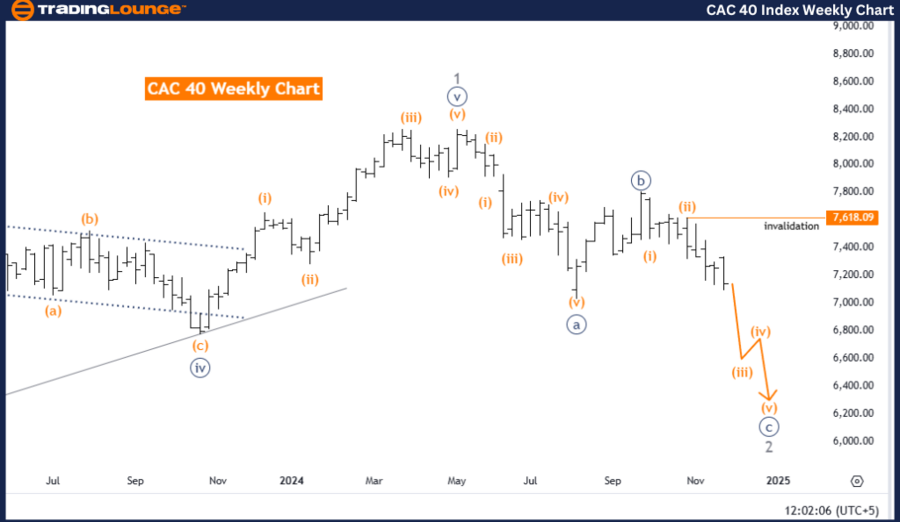
CAC 40 (France) Elliott Wave Analysis Trading Lounge Day Chart.
CAC 40 (France) Elliott Wave technical analysis
Technical details
-
Function: Bearish Trend.
-
Mode: Impulsive.
-
Structure: Gray Wave 3.
-
Position: Orange Wave 3.
-
Direction next higher degrees: Gray Wave 4.
-
Details: Gray wave 2 appears complete. Currently, gray wave 3 of orange wave 3 is developing.
-
Wave cancel invalidation level: 7618.09.
Analysis overview
The analysis focuses on the CAC 40 Index using Elliott Wave Theory on a daily chart, identifying a bearish trend. The market is currently in an impulsive mode, reflecting strong downward momentum.
The primary wave structure under observation is gray wave 3, which began after the completion of gray wave 2. This marks the continuation of the bearish movement.
The current position lies within orange wave 3, specifically in gray wave 3 of this structure. This phase signifies the intensification of the downward trend, with further declines expected before transitioning to gray wave 4, a corrective phase within the higher-degree structure.
Key level for invalidation
An invalidation level is set at 7618.09. If the index rises to this level, the current wave count and bearish outlook will be invalidated. This level acts as a critical threshold for risk management and confirmation of the bearish impulsive phase.
Summary
-
The Elliott Wave Analysis indicates that the CAC 40 index is in a bearish trend, with gray wave 3 actively unfolding as part of orange wave 3.
-
The completion of gray wave 2 confirmed the onset of this impulsive decline.
-
The bearish outlook remains valid as long as the index stays below the invalidation level of 7618.09.
-
Continued downward momentum in gray wave 3 is anticipated, followed by a corrective phase in gray wave 4.
CAC 40 (France) Elliott Wave Analysis Trading Lounge Weekly Chart.
CAC 40 (France) Elliott Wave technical analysis
Technical details
-
Function: Counter Trend.
-
Mode: Impulsive.
-
Structure: Orange Wave 3.
-
Position: Navy Blue Wave C.
-
Direction next higher degrees: Orange Wave 4.
-
Details: Orange wave 2 appears complete; orange wave 3 of 3 is currently developing.
-
Wave cancel invalidation level: 7618.09.
Analysis overview
This analysis evaluates the CAC 40 Index using Elliott Wave Theory on a weekly chart, identifying a counter-trend phase. The market is currently in an impulsive mode within orange wave 3, signaling strong movement within the broader corrective structure.
The progression follows the completion of orange wave 2, confirming the continuation of the current trend.
The current position lies in navy blue wave C, which is a key component of orange wave 3. This phase represents the active development of the impulsive wave, with further downward movement expected before transitioning into orange wave 4, a corrective phase at a higher degree.
Key level for invalidation
An invalidation level is set at 7618.09. If the index rises to this level, the current wave count and counter-trend outlook will be invalidated. This level serves as a critical point for risk management and confirmation of the counter-trend structure.
Summary
-
The Elliott Wave Analysis identifies the CAC 40 index in a counter-trend phase, with orange wave 3 actively unfolding after the completion of orange wave 2.
-
Navy blue wave C represents the ongoing impulsive movement within this structure.
-
The counter-trend outlook remains valid as long as the index stays below the invalidation level of 7618.09.
-
Further movement in orange wave 3 is anticipated before transitioning to a corrective phase in orange wave 4.
Technical analyst: Malik Awais.
CAC 40 (France) Elliott Wave technical analysis [Video]
Author

Peter Mathers
TradingLounge
Peter Mathers started actively trading in 1982. He began his career at Hoei and Shoin, a Japanese futures trading company.


