CAC 40 (France) Elliott Wave technical analysis [Video]
![CAC 40 (France) Elliott Wave technical analysis [Video]](https://editorial.fxstreet.com/images/TechnicalAnalysis/ChartPatterns/PointFigure/hand-pointing-graph-elements-of-this-image-furnished-by-nasa-76654497_XtraLarge.jpg)
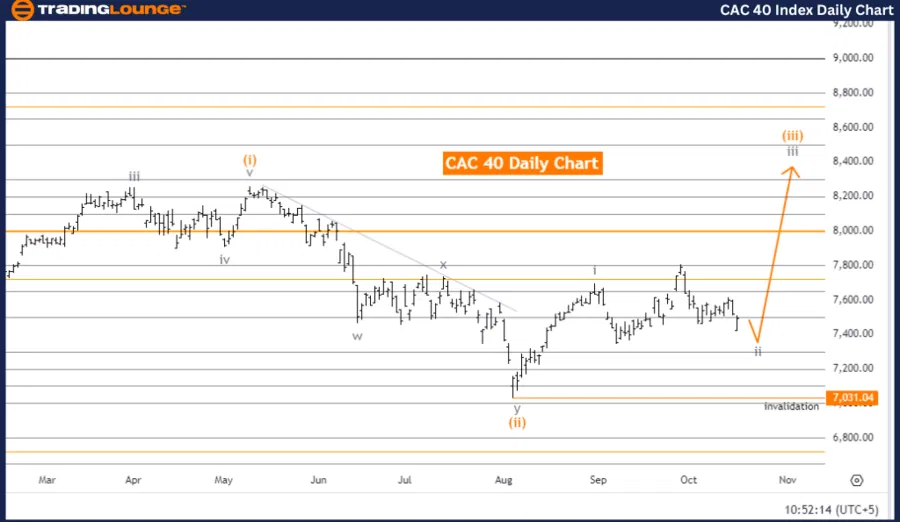
CAC 40 (France) Elliott Wave Analysis Trading Lounge day chart.
CAC 40 (France) Elliott Wave technical analysis
Function: Counter Trend.
Mode: Corrective.
Structure: Gray Wave 2.
Position: Orange Wave 3.
Direction next higher degrees: Gray Wave 3.
Details: Gray Wave 1 has been completed, and now Gray Wave 2 of Orange Wave 3 is unfolding.
Wave cancel invalidation level: 7,031.04.
The Elliott Wave analysis of the CAC 40 on the daily chart suggests the market is currently in a corrective phase, exhibiting a counter-trend movement. The main structure under observation is Gray Wave 2, which follows the completion of Gray Wave 1 in a larger corrective pattern.
Currently, Orange Wave 3 is progressing, and the analysis shows that Gray Wave 2 of this wave is unfolding. This phase represents a retracement or correction within the broader upward trend. With Gray Wave 1 (the first impulsive wave) now complete, Gray Wave 2 is forming as part of the corrective process.
The next expected development is Gray Wave 3, which will likely begin after Gray Wave 2 finishes. This suggests that once the current corrective phase concludes, the market should resume its primary upward trend, with Gray Wave 3 marking the next impulsive move in the sequence.
The invalidation level for this wave count is set at 7,031.04. If the market price drops below this level, the current wave structure would be invalidated, requiring a reevaluation of the analysis. As long as the market stays above this level, the corrective structure remains intact, and Gray Wave 2 is expected to conclude before the market moves upwards with Gray Wave 3.
Summary
The CAC 40 is currently in a corrective phase, with Gray Wave 2 developing after the completion of Gray Wave 1. The market is expected to continue this corrective movement before starting Gray Wave 3, with the invalidation level set at 7,031.04.
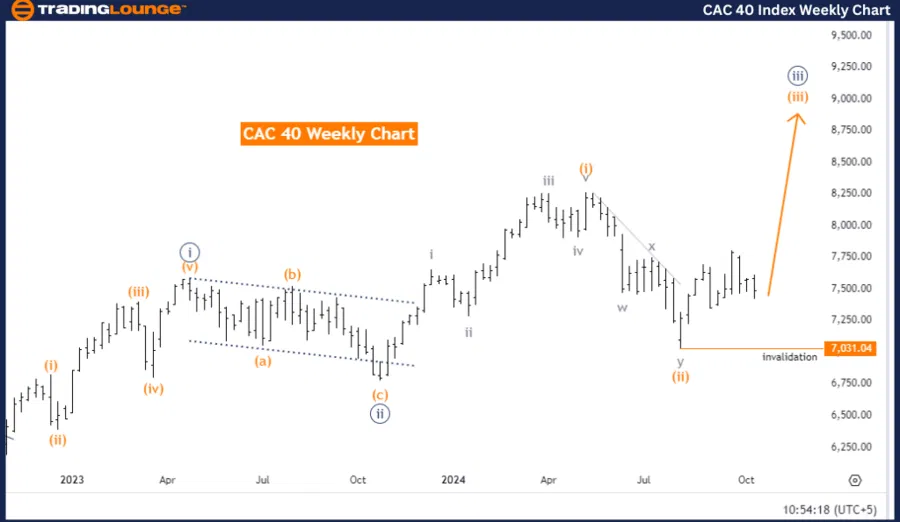
CAC 40 (France) Elliott Wave Analysis Trading Lounge weekly chart.
CAC 40 (France) Elliott Wave technical analysis
Function: Bullish Trend.
Mode: Impulsive.
Structure: Orange Wave 3.
Position: Navy Blue Wave 3.
Direction next lower degrees: Orange Wave 4.
Details: Orange Wave 2 is completed, and now Orange Wave 3 of 3 is unfolding.
Wave cancel invalidation level: 7,031.04.
The Elliott Wave analysis of the CAC 40 on the weekly chart highlights a bullish trend, defined by an impulsive wave pattern. The primary structure under observation is Orange Wave 3, which forms part of a larger impulsive sequence. The market is currently in Navy Blue Wave 3, indicating strong upward momentum within the ongoing trend.
According to the analysis, Orange Wave 2 has been completed, and Orange Wave 3 is now unfolding. This suggests that the market is in the middle of an upward phase, where the impulsive movement of Orange Wave 3 is pushing prices higher. This wave represents the third wave in the sequence, typically considered the strongest and longest wave in Elliott Wave theory, signaling robust bullish momentum in the market.
Once Orange Wave 3 concludes, the next expected movement is Orange Wave 4, which will introduce a corrective phase before the final impulsive push of Orange Wave 5. However, at present, Orange Wave 3 is still active, and the market continues to rise along this upward trajectory.
The invalidation level for this wave structure is set at 7,031.04. A drop below this level would invalidate the current wave count, requiring a reassessment of the market structure. As long as the price stays above this level, the bullish trend is likely to continue, with Orange Wave 3 driving the market higher.
Summary
The CAC 40 is in a bullish trend with Orange Wave 3 in progress following the completion of Orange Wave 2. The market is expected to continue its upward movement as part of this impulsive wave, with the invalidation level set at 7,031.04.
CAC 40 (France) Elliott Wave technical analysis [Video]
Author

Peter Mathers
TradingLounge
Peter Mathers started actively trading in 1982. He began his career at Hoei and Shoin, a Japanese futures trading company.


