CAC 40 (France) Elliott Wave technical analysis [Video]
![CAC 40 (France) Elliott Wave technical analysis [Video]](https://editorial.fxstreet.com/images/TechnicalAnalysis/ChartPatterns/PointFigure/hand-drawing-chart-show-70075327_XtraLarge.jpg)
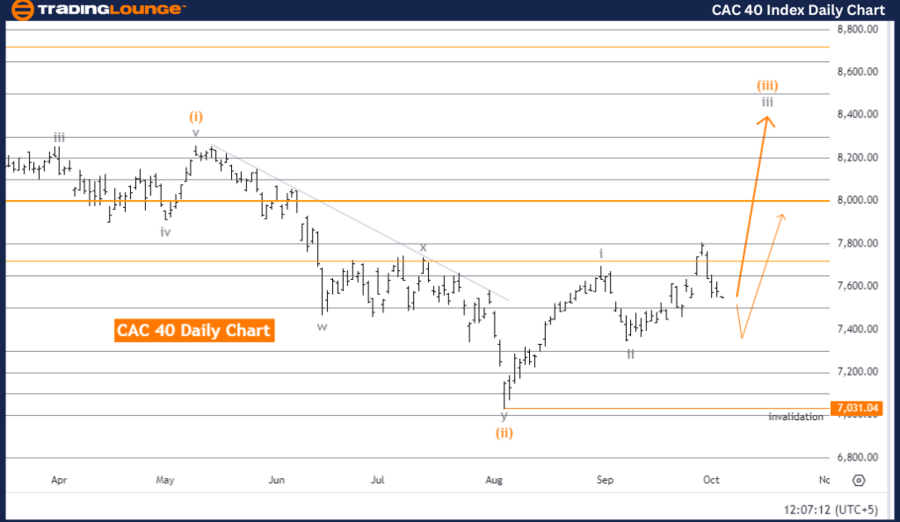
CAC 40 (France) Elliott Wave Analysis Tradinglounge - Day Chart
CAC 40 (France) Elliott Wave technical analysis
Function: Bullish Trend.
Mode: Impulsive.
Structure: Gray wave 3.
Position: Orange wave 3.
Direction next higher degrees: Gray wave 3 (may have started).
Details: Gray wave 2 appears completed. Gray wave 3 of orange wave 3 is now in progress.
Wave cancel invalid level: 7,031.04.
The Elliott Wave analysis for the CAC 40 daily chart suggests a bullish trend, indicating upward momentum in the market. The mode of movement is described as impulsive, which implies a strong advance aligned with the primary trend. The wave structure being analyzed is gray wave 3, part of a broader bullish sequence.
Currently, the market is situated in orange wave 3, within the larger structure of gray wave 3. Gray wave 2 is considered completed, and now gray wave 3 of orange wave 3 is unfolding.
According to Elliott Wave Theory, wave 3 is usually the most powerful and extended in an impulsive sequence. This suggests a strong upward movement and consistent momentum as the market continues to rise. The completion of gray wave 2 marks the end of the previous corrective phase, signaling the beginning of a new impulsive leg moving higher.
The analysis indicates that gray wave 3 may have already started, which would further confirm the ongoing bullish trend's strength. The next movement of a higher degree is expected to be gray wave 3, reinforcing the likelihood of continued upward progress in the market.
The critical invalidation level to monitor is 7,031.04. If the market falls below this level, the current Elliott Wave analysis would be deemed invalid, necessitating a reevaluation of the wave structure. This level is crucial in determining whether the bullish trend will remain intact.
In summary, the Elliott Wave analysis for the CAC 40 daily chart indicates a bullish trend, with both gray wave 3 and orange wave 3 in play. Traders should keep an eye on the invalidation level of 7,031.04 to confirm the continuation of the upward trend. As gray wave 3 progresses, the market is expected to maintain its upward momentum, pointing to further gains.
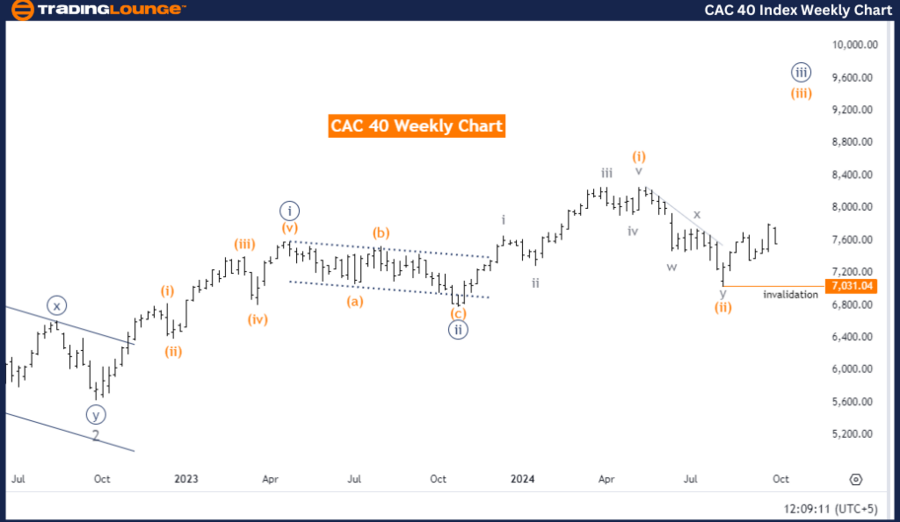
CAC 40 (France) Elliott Wave Analysis - Weekly Chart.
CAC 40 (France) Elliott Wave technical analysis
Function: Bullish Trend.
Mode: Impulsive.
Structure: Orange wave 3.
Position: Navy blue wave 3.
Direction next higher degrees: Orange wave 3 (started).
DETAILS: Orange wave 2 appears completed. Orange wave 3 of orange wave 3 is now in play.
Wave cancel invalid level: 7,031.04.
The Elliott Wave analysis for the CAC 40 weekly chart indicates a bullish trend, pointing to strong upward momentum in the market. The mode is described as impulsive, suggesting the market is advancing decisively in line with the primary trend. The wave structure under consideration is orange wave 3, part of a larger impulsive sequence.
At present, the market is positioned in navy blue wave 3, which lies within the broader structure of orange wave 3. The completion of orange wave 2 has already occurred, and now orange wave 3 of orange wave 3 is in progress. In Elliott Wave Theory, wave 3 is generally the most powerful and extended in an impulsive sequence, suggesting the market may experience sustained upward momentum as the bullish phase continues.
The analysis suggests that orange wave 3 has begun, indicating that the market is in the early stages of what is anticipated to be a strong rally. Since wave 3 often carries the most strength in a trend, this phase is likely to see significant market gains.
The critical invalidation level to monitor is 7,031.04. If the market dips below this level, the current Elliott Wave analysis would be invalid, necessitating a reassessment of the wave structure. This level is essential for confirming whether the bullish trend remains intact.
In summary, the Elliott Wave analysis for the CAC 40 weekly chart shows a strong bullish trend, with orange wave 3 and navy blue wave 3 in play. The market is expected to continue rising, driven by the powerful impulsive structure of wave 3. Traders should keep an eye on the invalidation level of 7,031.04 to confirm the continuation of this bullish trend.
CAC 40 (France) Elliott Wave technical analysis [Video]
Author

Peter Mathers
TradingLounge
Peter Mathers started actively trading in 1982. He began his career at Hoei and Shoin, a Japanese futures trading company.


