CAC 40 (France) Elliott Wave technical analysis [Video]
![CAC 40 (France) Elliott Wave technical analysis [Video]](https://editorial.fxstreet.com/images/TechnicalAnalysis/ChartPatterns/PointFigure/hand-point-to-graph-on-financial-graphs-success-concept-73251403_XtraLarge.jpg)
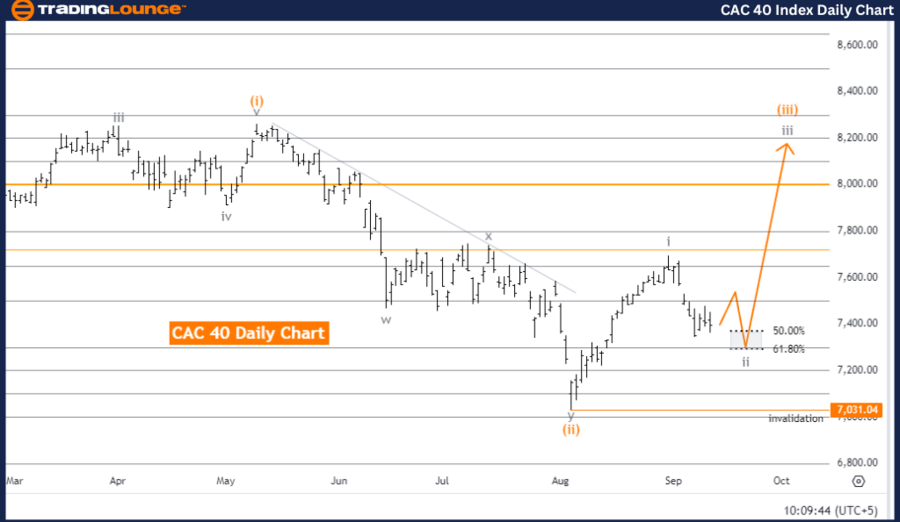
CAC 40 (France) Elliott Wave Analysis Trading Lounge Day Chart
CAC 40 (France) Elliott Wave technical analysis
-
Function: Counter Trend.
-
Mode: Corrective.
-
Structure: Gray wave 2.
-
Position: Orange wave 3.
-
Direction next higher degrees: Gray wave 3.
- Details: Gray wave 1 appears completed. Now, gray wave 2 of orange wave 3 is in play.
-
Wave cancel invalid level: 7,031.04
The CAC 40 Elliott Wave analysis for the daily chart shows that the index is currently experiencing a counter-trend in a corrective mode. The structure being monitored is gray wave 2, while its position is within orange wave 3. This indicates the market is in a corrective phase before potentially resuming its next impulsive movement.
Gray wave 1 seems to be complete, and gray wave 2 of orange wave 3 is now unfolding. This means the market is currently in a retracement or consolidation period, which is typical for a wave 2 under Elliott Wave theory. Once this corrective wave is finished, the index is expected to resume its upward movement in gray wave 3, within the broader context of orange wave 3.
The analysis further highlights the next higher degree movement, signaling gray wave 3 after the completion of the ongoing corrective wave. This anticipated gray wave 3 would likely mark a return to a bullish trend once the correction concludes.
A key point in this analysis is the wave cancellation level set at 7,031.04. Should the price drop below this level, the current wave count will become invalid, necessitating a reanalysis of the structure. However, as long as the price remains above this invalidation level, the current wave count stays intact, and the market is expected to continue progressing through gray wave 2, leading to the onset of gray wave 3.
In summary, the CAC 40 is in gray wave 2 of orange wave 3. After this correction concludes, the market is likely to enter gray wave 3. The wave count remains valid unless the price falls below 7,031.04.
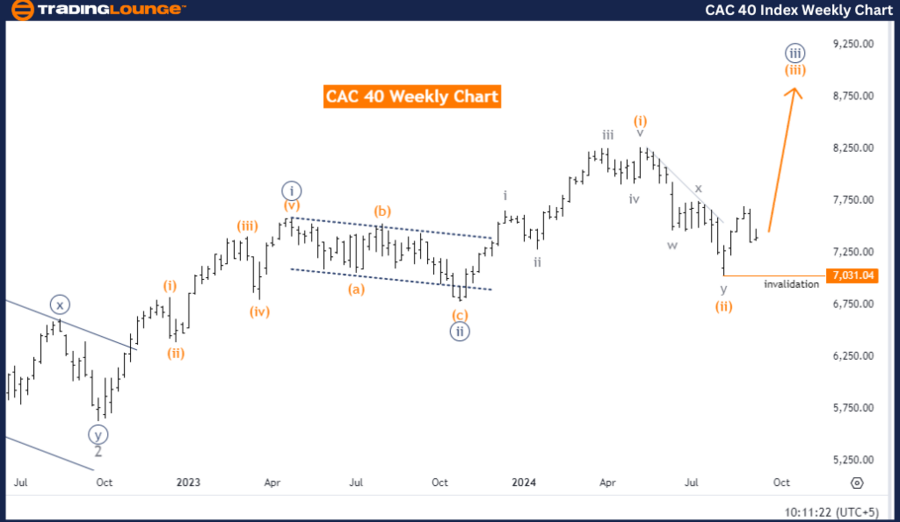
CAC 40 (France) Elliott Wave Analysis Trading Lounge Weekly Chart.
CAC 40 (France) Elliott Wave technical analysis
-
Function: Bullish Trend.
-
Mode: Impulsive.
-
Structure: Orange wave 3.
-
Position: Navy blue wave 3.
-
Direction next higher degrees: Orange wave 3 (started).
-
Details: Orange wave 2 appears completed. Now, orange wave 3 of 3 is in play.
-
Wave cancel invalid level: 7,031.04.
The CAC 40 Elliott Wave analysis on the weekly chart highlights that the index is currently in a bullish trend with an impulsive mode. The analysis focuses on orange wave 3, with the current position being within navy blue wave 3. This suggests that the index is progressing through a strong upward phase, characterized by impulsive movements typical of wave 3.
Based on the analysis, orange wave 2 seems to have completed, and now orange wave 3 of 3 is unfolding. This transition indicates that the market has moved out of its corrective phase and is now in an impulsive wave, pushing the index higher. The primary focus remains on the continuation of the bullish trend as orange wave 3 develops further.
The next higher degree direction points to the continuation of orange wave 3, which has already begun. This suggests that upward momentum is expected to continue in the near future as the index moves through different stages of wave 3.
The wave cancellation level is set at 7,031.04. If the price drops below this level, the current wave structure and bullish outlook would become invalid, requiring a reassessment of the wave count. However, as long as the index remains above this level, the impulsive wave count stays valid, and the index is expected to continue rising as orange wave 3 progresses.
In summary, the CAC 40 weekly chart shows a strong bullish trend, with orange wave 3 currently in play. The index is positioned within navy blue wave 3, and as long as the price stays above 7,031.04, the impulsive upward movement is expected to continue.
CAC 40 (France) Elliott Wave technical analysis [Video]
Author

Peter Mathers
TradingLounge
Peter Mathers started actively trading in 1982. He began his career at Hoei and Shoin, a Japanese futures trading company.


