CAC 40 (France) Elliott Wave technical analysis [Video]
![CAC 40 (France) Elliott Wave technical analysis [Video]](https://editorial.fxstreet.com/images/Markets/Equities/financial-figures-7116094_XtraLarge.jpg)
CAC 40 (France) Elliott Wave technical analysis
- Function: Trend.
-
Mode: Impulsive.
-
Structure: Orange wave 3.
-
Position: Navy blue wave 3.
-
Next higher degrees direction: Orange wave 3 (initiated).
- Details: The analysis indicates that orange wave 2 seems to be completed, leading to the current play of orange wave 3. The invalidation level for this wave structure is set at 6773.81.
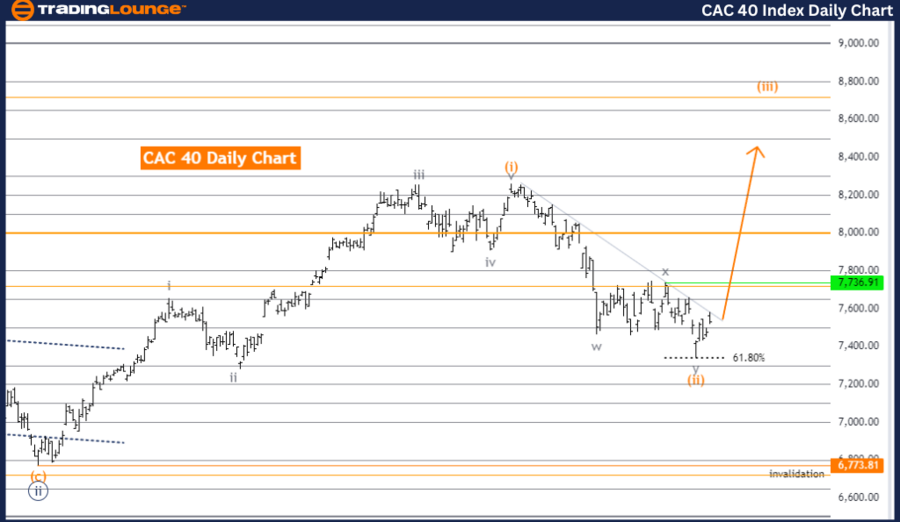
The daily chart for the CAC 40 shows a trending function in an impulsive mode. The existing wave structure is identified as orange wave 3, nested within a broader navy blue wave 3. This suggests a significant upward movement within the larger wave framework, indicating a continuation of the bullish trend.
Technical analysis suggests that orange wave 2 has concluded, marking the end of a corrective phase and the onset of the impulsive phase, now represented by orange wave 3. The completion of orange wave 2 is pivotal, as it signifies a transition, confirming the likelihood of a continued upward trajectory in the market.
The direction for subsequent higher degrees is designated as orange wave 3, which has already begun. This indicates that the current upward movement is part of a broader impulsive wave sequence. The market is expected to sustain its bullish momentum as it advances through the subsequent waves of this sequence.
The wave invalidation level is established at 6773.81. This level is crucial for validating the current wave structure. A drop below this threshold would invalidate the existing wave count, suggesting that the expected wave pattern may no longer be applicable, requiring a reevaluation of the wave count and the overall market outlook.
In summary, the daily Elliott Wave Analysis of the CAC 40 suggests the index is currently in an impulsive upward trend within orange wave 3, positioned within navy blue wave 3. The conclusion of orange wave 2 marks the end of the corrective phase and the initiation of a new impulsive phase, with orange wave 3 now active. The wave cancellation invalid level of 6773.81 is a critical point for verifying the current wave structure, and if breached, would necessitate a reassessment of the wave count.
CAC 40 (France) Elliott Wave daily analysis
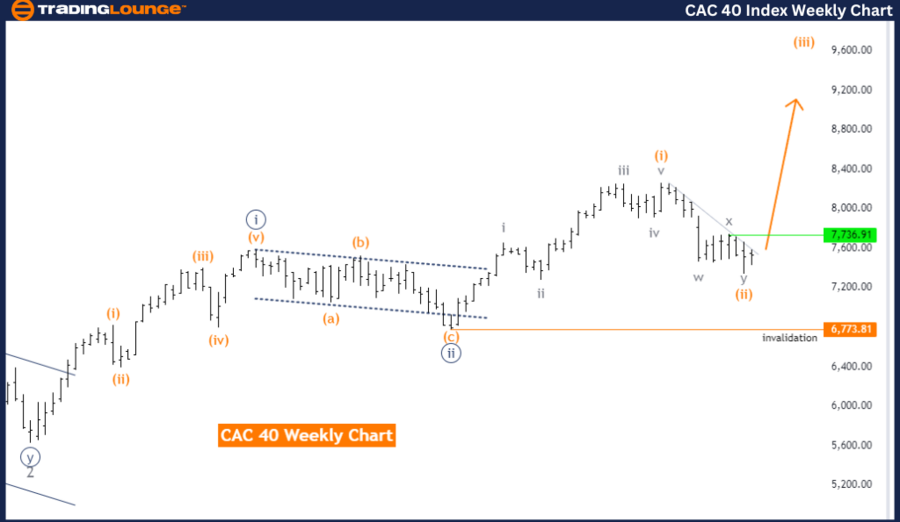
CAC 40 (France) Elliott Wave weekly chart
-
Function: Trend.
-
Mode: Impulsive.
-
Structure: Orange wave 3.
-
Position: Navy blue wave 3.
-
Next higher degrees direction: Orange wave 3 (initiated).
-
Details: The analysis suggests that orange wave 2 seems to have concluded, transitioning to orange wave 3. The invalidation level for this wave structure is set at 6773.81.
The weekly chart for the CAC 40 demonstrates a trending function in an impulsive mode. The current wave structure is defined as orange wave 3, positioned within the larger navy blue wave 3. This indicates a strong bullish trend, signaling continued upward momentum in the market.
According to the technical analysis, it appears that orange wave 2 has concluded. This completion marks the end of the corrective phase and the start of a new impulsive phase, represented by orange wave 3. The completion of orange wave 2 is a significant turning point, confirming that the market is now likely to experience an upward trend.
The direction for the next higher degrees is identified as orange wave 3, which has already commenced. This suggests that the current upward movement is part of a larger impulsive wave sequence. The market is expected to continue its bullish momentum as it advances through the subsequent waves of this sequence.
The wave invalidation level is set at 6773.81. This level serves as a critical threshold for validating the current wave structure. If the CAC 40 drops below this level, the present wave count would be invalidated, indicating that the anticipated wave pattern may no longer be applicable. This would necessitate a reevaluation of the wave count and the overall market outlook.
In summary, the Elliott Wave Analysis of the CAC 40 on the weekly chart indicates that the index is currently in the midst of a new impulsive upward trend within orange wave 3, positioned within navy blue wave 3. The completion of orange wave 2 marks the end of the corrective phase and the beginning of a new impulsive phase, with orange wave 3 now in play. The wave cancellation invalid level of 6773.81 is a critical point for validating the current wave structure, and if breached, would require a reassessment of the wave count.
CAC 40 (France) Elliott Wave technical analysis [Video]
Author

Peter Mathers
TradingLounge
Peter Mathers started actively trading in 1982. He began his career at Hoei and Shoin, a Japanese futures trading company.


