CAC 40 Elliott Wave technical analysis [Video]
![CAC 40 Elliott Wave technical analysis [Video]](https://editorial.fxstreet.com/images/Markets/Equities/Industries/Food/cans-637322928168972480_XtraLarge.jpg)
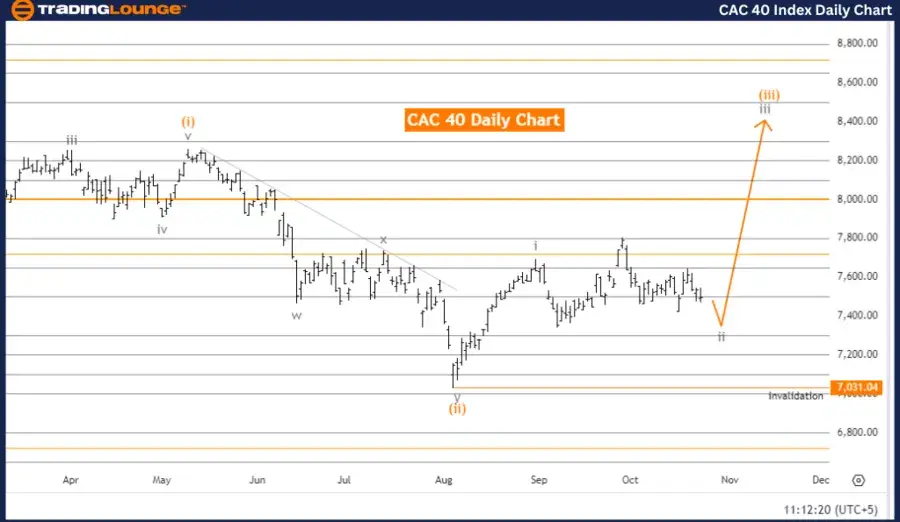
CAC 40 (France) Elliott Wave Analysis Trading Lounge Day Chart,
CAC 40 (France) Elliott Wave technical analysis
-
Function: Counter Trend.
-
Mode: Corrective.
-
Structure: Gray wave 2.
-
Position: Orange wave 3.
-
Direction next higher degrees: Gray wave 3.
-
Details: Gray wave 1 appears completed, with gray wave 2 of orange wave 3 now in progress.
-
Wave cancel invalidation level: 7,031.04.
The Elliott Wave analysis for the CAC 40 daily chart indicates that the market is currently in a corrective phase, representing a counter-trend movement. The focus is on gray wave 2, which has followed the completion of gray wave 1. According to the analysis, gray wave 1 is finished, and the market is now progressing through gray wave 2 of orange wave 3. This suggests that the market is undergoing a short-term pullback before resuming its overall trend.
At present, the market is positioned within orange wave 3, which forms part of a larger upward cycle. Gray wave 2, a corrective wave, is playing out, signaling a temporary decline before the market continues its upward movement into gray wave 3, the next phase of this Elliott Wave sequence.
The higher degree trend points toward gray wave 3, meaning that once the current corrective wave 2 is complete, the market is expected to resume its bullish trajectory. The wave cancellation invalidation level is set at 7,031.04. If the price drops below this level, the current wave count would be invalid, necessitating a reassessment of the wave structure.
In summary, the CAC 40 daily Elliott Wave analysis shows that gray wave 1 has been completed, and gray wave 2 is currently unfolding within orange wave 3. This corrective phase is expected to end before the market resumes its upward trend in gray wave 3. The structure remains valid as long as the price does not fall below 7,031.04.
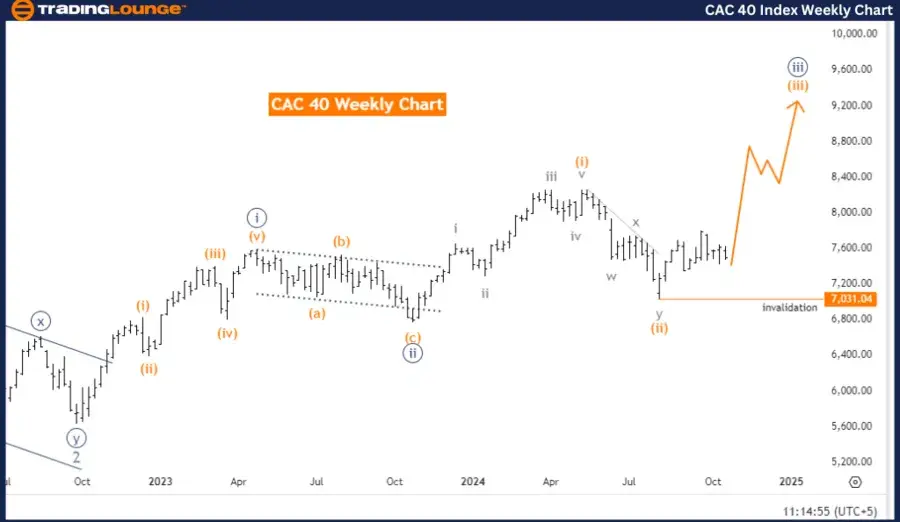
CAC 40 (France) Elliott Wave Analysis Trading Lounge Weekly Chart,
CAC 40 (France) Elliott Wave technical analysis
-
Function: Bullish Trend.
-
Mode: Impulsive.
-
Structure: Orange wave 3.
-
Position: Navy Blue Wave 3.
-
Direction next lower degrees: Orange wave 4.
-
Details: Orange wave 2 appears completed, with orange wave 3 of 3 now in progress.
-
Wave cancel invalidation level: 7,031.04.
The Elliott Wave analysis for the CAC 40 weekly chart indicates a bullish trend, with the market moving within an impulsive wave structure. The primary wave being analyzed is orange wave 3, which is part of a larger upward movement. The current position of the market is in navy blue wave 3, signaling that the market is in a strong upward phase.
Orange wave 2 is considered complete, and now orange wave 3 of 3 is unfolding. This suggests that the market is in the midst of an impulsive wave sequence, where wave 3 typically represents the strongest and most substantial price movement. The market is expected to maintain its bullish momentum as it moves through this wave.
The next lower degree wave is orange wave 4, which will likely emerge after the completion of the current orange wave 3. This implies that while the market is currently advancing, a corrective move in the form of orange wave 4 is anticipated in the future.
The invalidation level for this wave structure is set at 7,031.04. If the price drops below this level, the current Elliott Wave count will be invalid, and a reassessment of the market's wave pattern will be required.
In conclusion, the CAC 40 weekly Elliott Wave analysis shows that the market is in a bullish trend, with orange wave 3 currently in play and orange wave 2 already completed. The market is advancing through navy blue wave 3, and after this upward phase, orange wave 4 is expected. The wave structure remains valid as long as the price stays above 7,031.04.
Technical analyst: Malik Awais.
CAC 40 (France) Elliott Wave technical analysis [Video]
Author

Peter Mathers
TradingLounge
Peter Mathers started actively trading in 1982. He began his career at Hoei and Shoin, a Japanese futures trading company.


