|

BYD Company Limited (1211.HK) breaking in wave three

BYD Company Limited (ticker: 1211.HK on the Hong Kong Stock Exchange) is a Chinese multinational powerhouse headquartered in Shenzhen. Initially a battery maker, it became the world’s top producer of plug-in electric vehicles by 2022, surpassing Tesla with over 3 million new energy vehicles sold by 2023, thanks to hits like the affordable Dolphin and its innovative Blade Battery. The stock has recently broken to new all-time high within wave III. Below we will take a look at the long term Elliott Wave path.

BYD monthly Elliott Wave chart

Chart

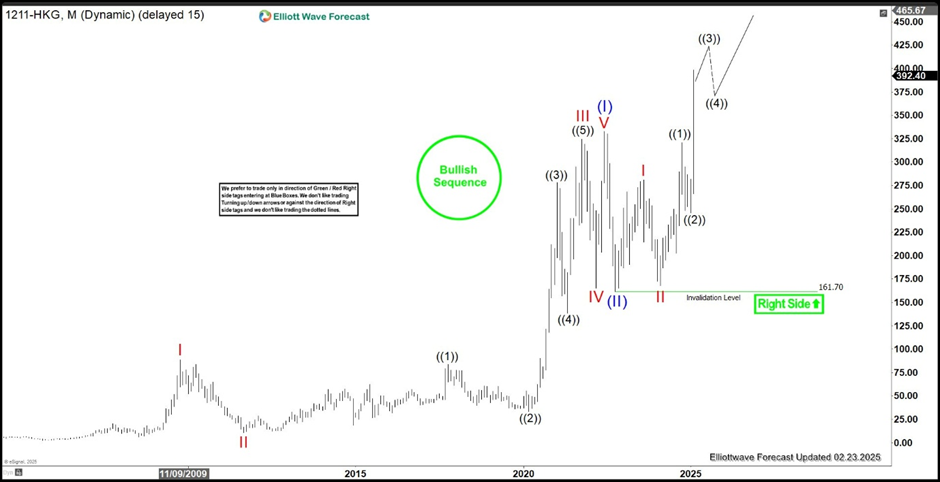
Monthly Elliott Wave Chart of BYD above shows the stock extends to new all-time high within wave (III). From all-time low, the stock rallied impulsively in 5 waves where wave I ended at 88.4 and pullback in wave II ended at 10.92. The stock then rallied higher in wave III towards 324.6 and pullback in wave IV ended at 165. Final wave V higher ended at 333 which completed wave (I) in higher degree. Pullback in wave (II) ended at 161.7 and the stock is now rallying in wave (III) higher. As far as pivot at 161.7 low holds, expect pullback to find support in 3, 7, 11 swing for more upside.

BYD daily Elliott Wave chart

Chart

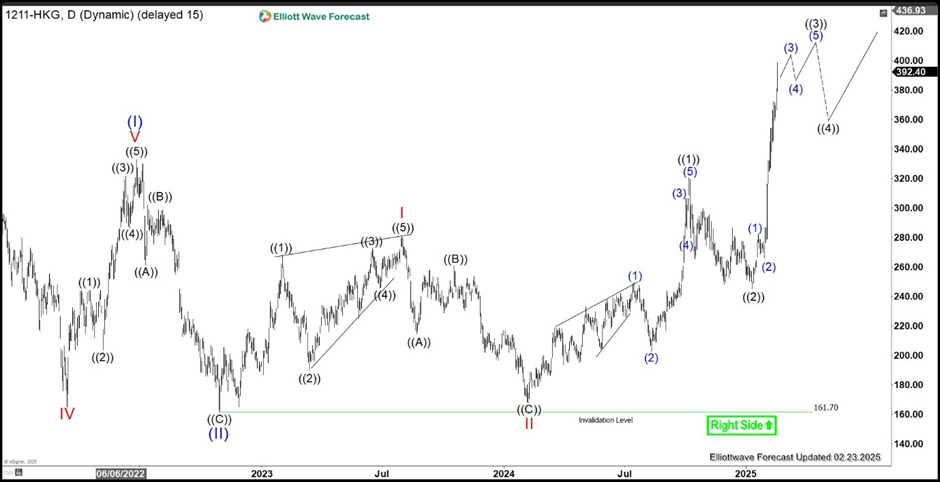
Daily Elliott Wave Chart of BYD above shows the stock is rallying higher within wave (III). Wave (I) ended at 333 and pullback in wave (II) ended at 161.7. Up from there, wave I ended at 280.6 and pullback in wave II ended at 167.80. The stock then resumed higher in a nest. Up from there, wave ((1)) ended at 320.8 and wave ((2)) ended at 245.4. Expect the stock to extend a few more highs to complete wave ((3)), then it should pullback in wave ((4)) to correct cycle from 1.13.2025 low before it resumes higher. Near term, as far as pivot at 161.7 low stays intact, expect pullback to find support in 3, 7, 11 swing for more upside.

Author

Elliott Wave Forecast Team

Elliott Wave Forecast Team

ElliottWave-Forecast.com

More from Elliott Wave Forecast Team
Share:

Editor's Picks

EUR/USD accelerates losses, focus is on 1.1800

EUR/USD’s selling pressure is gathering pace now, opening the door to a potential test of the key 1.1800 region sooner rather than later. The pair’s pullback comes on the back of marked gains in the US Dollar following US data releases and the publication of the FOMC Minutes later in the day.

GBP/USD turns negative near 1.3540

GBP/USD reverses its initial upside momentum and is now adding to previous declines, revisiting at the same time the 1.3540 region on Wednesday. Cable’s downtick comes on the back of decent gains in the Greenback and easing UK inflation figures, which seem to have reinforced the case for a BoE rate cut in March.

Gold reclaims $5,000 and above

Gold is back on the front foot on Wednesday, shaking off part of the early week softness and challenging two-day highs just above the key $5,000 mark per troy ounce. The move comes ahead of the FOMC Minutes and is unfolding despite an intense rebound in the US Dollar.

Fed Minutes to shed light on January hold decision amid hawkish rate outlook

The Minutes of the Fed’s January 27-28 monetary policy meeting will be published today. Details of discussions on the decision to leave the policy rate unchanged will be scrutinized by investors.

Mixed UK inflation data no gamechanger for the Bank of England

Food inflation plunged in January, but service sector price pressure is proving stickier. We continue to expect Bank of England rate cuts in March and June. The latest UK inflation read is a mixed bag for the Bank of England, but we doubt it drastically changes the odds of a March rate cut.

Sui extends sideways action ahead of Grayscale’s GSUI ETF launch

Sui is extending its downtrend for the second consecutive day, trading at 0.95 at the time of writing on Wednesday. The Layer-1 token is down over 16% in February and approximately 34% from the start of the year, aligning with the overall bearish sentiment across the crypto market.